Our official English website, www.x-mol.net, welcomes your
feedback! (Note: you will need to create a separate account there.)
Structural MRI at 7T reveals amygdala nuclei and hippocampal subfield volumetric association with Major Depressive Disorder symptom severity.
Scientific Reports ( IF 3.8 ) Pub Date : 2019-07-15 , DOI: 10.1038/s41598-019-46687-7 S S G Brown 1 , J W Rutland 1 , G Verma 1 , R E Feldman 1 , J Alper 1 , M Schneider 2 , B N Delman 3 , J M Murrough 2, 4 , P Balchandani 1
Scientific Reports ( IF 3.8 ) Pub Date : 2019-07-15 , DOI: 10.1038/s41598-019-46687-7 S S G Brown 1 , J W Rutland 1 , G Verma 1 , R E Feldman 1 , J Alper 1 , M Schneider 2 , B N Delman 3 , J M Murrough 2, 4 , P Balchandani 1
Affiliation

|
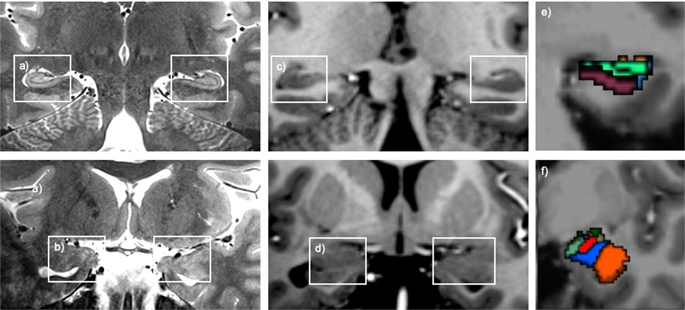
Subcortical volumetric changes in major depressive disorder (MDD) have been purported to underlie depressive symptomology, however, the evidence to date remains inconsistent. Here, we investigated limbic volumes in MDD, utilizing high-resolution structural images to allow segmentation of the hippocampus and amygdala into their constituent substructures. Twenty-four MDD patients and twenty matched controls underwent structural MRI at 7T field strength. All participants completed the Montgomery-Asberg Depression Rating Scale (MADRS) to quantify depressive symptomology. For the MDD group, volumes of the amygdala right lateral nucleus (p = 0.05, r2 = 0.24), left cortical nucleus (p = 0.032, r2 = 0.35), left accessory basal nucleus (p = 0.04, r2 = 0.28) and bilateral corticoamygdaloid transition area (right hemisphere p = 0.032, r2 = 0.38, left hemisphere p = 0.032, r2 = 0.35) each displayed significant negative associations with MDD severity. The bilateral centrocortical (right hemisphere p = 0.032, r2 = 0.31, left hemisphere p = 0.032, r2 = 0.32) and right basolateral complexes (p = 0.05, r2 = 0.24) also displayed significant negative relationships with depressive symptoms. Using high-field strength MRI, we report the novel finding that MDD severity is consistently negatively associated with amygdala nuclei, linking volumetric reductions with worsening depressive symptoms.
中文翻译:

7T 的结构 MRI 显示杏仁核和海马亚区体积与重度抑郁症症状严重程度的相关性。
重度抑郁症(MDD)的皮层下体积变化被认为是抑郁症状的基础,然而,迄今为止的证据仍然不一致。在这里,我们研究了 MDD 中的边缘体积,利用高分辨率结构图像将海马体和杏仁核分割为其组成子结构。 24 名 MDD 患者和 20 名匹配的对照者接受了 7T 场强的结构 MRI。所有参与者均完成了蒙哥马利-阿斯伯格抑郁评定量表 (MADRS) 以量化抑郁症状。对于 MDD 组,杏仁核右侧外侧核 (p = 0.05,r2 = 0.24)、左侧皮质核 (p = 0.032,r2 = 0.35)、左侧副基底核 (p = 0.04,r2 = 0.28) 和双侧杏仁核的体积皮质杏仁样过渡区(右半球 p = 0.032,r2 = 0.38,左半球 p = 0.032,r2 = 0.35)均与 MDD 严重程度呈显着负相关。双侧中央皮质(右半球 p = 0.032,r2 = 0.31,左半球 p = 0.032,r2 = 0.32)和右基底外侧复合体(p = 0.05,r2 = 0.24)也显示出与抑郁症状的显着负相关。使用高场强 MRI,我们报告了一项新发现,即 MDD 严重程度始终与杏仁核呈负相关,将体积减少与抑郁症状恶化联系起来。
更新日期:2019-07-15
中文翻译:

7T 的结构 MRI 显示杏仁核和海马亚区体积与重度抑郁症症状严重程度的相关性。
重度抑郁症(MDD)的皮层下体积变化被认为是抑郁症状的基础,然而,迄今为止的证据仍然不一致。在这里,我们研究了 MDD 中的边缘体积,利用高分辨率结构图像将海马体和杏仁核分割为其组成子结构。 24 名 MDD 患者和 20 名匹配的对照者接受了 7T 场强的结构 MRI。所有参与者均完成了蒙哥马利-阿斯伯格抑郁评定量表 (MADRS) 以量化抑郁症状。对于 MDD 组,杏仁核右侧外侧核 (p = 0.05,r2 = 0.24)、左侧皮质核 (p = 0.032,r2 = 0.35)、左侧副基底核 (p = 0.04,r2 = 0.28) 和双侧杏仁核的体积皮质杏仁样过渡区(右半球 p = 0.032,r2 = 0.38,左半球 p = 0.032,r2 = 0.35)均与 MDD 严重程度呈显着负相关。双侧中央皮质(右半球 p = 0.032,r2 = 0.31,左半球 p = 0.032,r2 = 0.32)和右基底外侧复合体(p = 0.05,r2 = 0.24)也显示出与抑郁症状的显着负相关。使用高场强 MRI,我们报告了一项新发现,即 MDD 严重程度始终与杏仁核呈负相关,将体积减少与抑郁症状恶化联系起来。


 京公网安备 11010802027423号