当前位置:
X-MOL 学术
›
Build. Environ.
›
论文详情
Our official English website, www.x-mol.net, welcomes your feedback! (Note: you will need to create a separate account there.)
Analysis of the accuracy on PMV – PPD model using the ASHRAE Global Thermal Comfort Database II
Building and Environment ( IF 7.1 ) Pub Date : 2019-04-01 , DOI: 10.1016/j.buildenv.2019.01.055 Toby Cheung , Stefano Schiavon , Thomas Parkinson , Peixian Li , Gail Brager
Building and Environment ( IF 7.1 ) Pub Date : 2019-04-01 , DOI: 10.1016/j.buildenv.2019.01.055 Toby Cheung , Stefano Schiavon , Thomas Parkinson , Peixian Li , Gail Brager
|
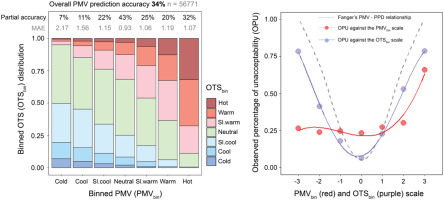
Abstract The predicted mean vote (PMV) and predicted percentage of dissatisfied (PPD) are the most widely used thermal comfort indices. Yet, their performance remains a contested topic. The ASHRAE Global Thermal Comfort Database II, the largest of its kind, was used to evaluate the prediction accuracy of the PMV/PPD model. We focused on: (i) the accuracy of PMV in predicting both observed thermal sensation (OTS) or observed mean vote (OMV) and (ii) comparing the PMV-PPD relationship with binned OTS – observed percentage of unacceptability (OPU). The accuracy of PMV in predicting OTS was only 34%, meaning that the thermal sensation is incorrectly predicted two out of three times. PMV had a mean absolute error of one unit on the thermal sensation scale and its accuracy decreased towards the ends of the thermal sensation scale. The accuracy of PMV was similarly low for air-conditioned, naturally ventilated and mixed-mode buildings. In addition, the PPD was not able to predict the dissatisfaction rate. If the PMV model would perfectly predict thermal sensation, then PPD accuracy is higher close to neutrality but it would overestimate dissatisfaction by approximately 15–25% outside of it. Furthermore, PMV-PPD accuracy varied strongly between ventilation strategies, building types and climate groups. These findings demonstrate the low prediction accuracy of the PMV–PPD model, indicating the need to develop high prediction accuracy thermal comfort models. For demonstration, we developed a simple thermal prediction model just based on air temperature and its accuracy, for this database, was higher than PMV.
中文翻译:

使用 ASHRAE 全球热舒适数据库 II 分析 PMV – PPD 模型的准确性
摘要 预测平均投票(PMV)和预测不满意百分比(PPD)是最广泛使用的热舒适指数。然而,他们的表现仍然是一个有争议的话题。ASHRAE 全球热舒适数据库 II 是同类中最大的,用于评估 PMV/PPD 模型的预测精度。我们专注于:(i) PMV 在预测观察到的热感觉 (OTS) 或观察到的平均投票 (OMV) 方面的准确性,以及 (ii) 将 PMV-PPD 关系与分箱 OTS – 观察到的不可接受百分比 (OPU) 进行比较。PMV 在预测 OTS 方面的准确率仅为 34%,这意味着热感觉被错误预测了三分之二。PMV 在热感觉量表上的平均绝对误差为 1 个单位,并且其准确度随着热感觉量表的末端而下降。对于空调、自然通风和混合模式建筑,PMV 的准确度同样较低。此外,PPD 无法预测不满意率。如果 PMV 模型可以完美地预测热感觉,那么 PPD 准确度更高,接近中性,但它会高估不满意程度,大约 15-25%。此外,PMV-PPD 准确性在通风策略、建筑类型和气候组之间差异很大。这些发现表明 PMV-PPD 模型的预测精度较低,表明需要开发高预测精度的热舒适模型。为了演示,我们开发了一个仅基于气温的简单热预测模型,对于该数据库而言,其准确性高于 PMV。自然通风和混合模式建筑。此外,PPD 无法预测不满意率。如果 PMV 模型可以完美地预测热感觉,那么 PPD 准确度更高,接近中性,但它会高估不满意程度,大约 15-25%。此外,PMV-PPD 准确性在通风策略、建筑类型和气候组之间差异很大。这些发现表明 PMV-PPD 模型的预测精度较低,表明需要开发高预测精度的热舒适模型。为了演示,我们开发了一个仅基于气温的简单热预测模型,对于该数据库而言,其准确性高于 PMV。自然通风和混合模式建筑。此外,PPD 无法预测不满意率。如果 PMV 模型可以完美地预测热感觉,那么 PPD 准确度更高,接近中性,但它会高估不满意程度,大约 15-25%。此外,PMV-PPD 准确性在通风策略、建筑类型和气候组之间差异很大。这些发现表明 PMV-PPD 模型的预测精度较低,表明需要开发高预测精度的热舒适模型。为了演示,我们开发了一个仅基于气温的简单热预测模型,对于该数据库而言,其准确性高于 PMV。如果 PMV 模型可以完美地预测热感觉,那么 PPD 准确度更高,接近中性,但它会高估不满意程度,大约 15-25%。此外,PMV-PPD 准确性在通风策略、建筑类型和气候组之间差异很大。这些发现表明 PMV-PPD 模型的预测精度较低,表明需要开发高预测精度的热舒适模型。为了演示,我们开发了一个仅基于气温的简单热预测模型,对于该数据库而言,其准确性高于 PMV。如果 PMV 模型可以完美地预测热感觉,那么 PPD 准确度更高,接近中性,但它会高估不满意程度,大约 15-25%。此外,PMV-PPD 准确性在通风策略、建筑类型和气候组之间差异很大。这些发现表明 PMV-PPD 模型的预测精度较低,表明需要开发高预测精度的热舒适模型。为了演示,我们开发了一个仅基于气温的简单热预测模型,对于该数据库而言,其准确性高于 PMV。建筑类型和气候组。这些发现表明 PMV-PPD 模型的预测精度较低,表明需要开发高预测精度的热舒适模型。为了演示,我们开发了一个仅基于气温的简单热预测模型,对于该数据库而言,其准确性高于 PMV。建筑类型和气候组。这些发现表明 PMV-PPD 模型的预测精度较低,表明需要开发高预测精度的热舒适模型。为了演示,我们开发了一个仅基于气温的简单热预测模型,对于该数据库而言,其准确性高于 PMV。
更新日期:2019-04-01
中文翻译:
使用 ASHRAE 全球热舒适数据库 II 分析 PMV – PPD 模型的准确性
摘要 预测平均投票(PMV)和预测不满意百分比(PPD)是最广泛使用的热舒适指数。然而,他们的表现仍然是一个有争议的话题。ASHRAE 全球热舒适数据库 II 是同类中最大的,用于评估 PMV/PPD 模型的预测精度。我们专注于:(i) PMV 在预测观察到的热感觉 (OTS) 或观察到的平均投票 (OMV) 方面的准确性,以及 (ii) 将 PMV-PPD 关系与分箱 OTS – 观察到的不可接受百分比 (OPU) 进行比较。PMV 在预测 OTS 方面的准确率仅为 34%,这意味着热感觉被错误预测了三分之二。PMV 在热感觉量表上的平均绝对误差为 1 个单位,并且其准确度随着热感觉量表的末端而下降。对于空调、自然通风和混合模式建筑,PMV 的准确度同样较低。此外,PPD 无法预测不满意率。如果 PMV 模型可以完美地预测热感觉,那么 PPD 准确度更高,接近中性,但它会高估不满意程度,大约 15-25%。此外,PMV-PPD 准确性在通风策略、建筑类型和气候组之间差异很大。这些发现表明 PMV-PPD 模型的预测精度较低,表明需要开发高预测精度的热舒适模型。为了演示,我们开发了一个仅基于气温的简单热预测模型,对于该数据库而言,其准确性高于 PMV。自然通风和混合模式建筑。此外,PPD 无法预测不满意率。如果 PMV 模型可以完美地预测热感觉,那么 PPD 准确度更高,接近中性,但它会高估不满意程度,大约 15-25%。此外,PMV-PPD 准确性在通风策略、建筑类型和气候组之间差异很大。这些发现表明 PMV-PPD 模型的预测精度较低,表明需要开发高预测精度的热舒适模型。为了演示,我们开发了一个仅基于气温的简单热预测模型,对于该数据库而言,其准确性高于 PMV。自然通风和混合模式建筑。此外,PPD 无法预测不满意率。如果 PMV 模型可以完美地预测热感觉,那么 PPD 准确度更高,接近中性,但它会高估不满意程度,大约 15-25%。此外,PMV-PPD 准确性在通风策略、建筑类型和气候组之间差异很大。这些发现表明 PMV-PPD 模型的预测精度较低,表明需要开发高预测精度的热舒适模型。为了演示,我们开发了一个仅基于气温的简单热预测模型,对于该数据库而言,其准确性高于 PMV。如果 PMV 模型可以完美地预测热感觉,那么 PPD 准确度更高,接近中性,但它会高估不满意程度,大约 15-25%。此外,PMV-PPD 准确性在通风策略、建筑类型和气候组之间差异很大。这些发现表明 PMV-PPD 模型的预测精度较低,表明需要开发高预测精度的热舒适模型。为了演示,我们开发了一个仅基于气温的简单热预测模型,对于该数据库而言,其准确性高于 PMV。如果 PMV 模型可以完美地预测热感觉,那么 PPD 准确度更高,接近中性,但它会高估不满意程度,大约 15-25%。此外,PMV-PPD 准确性在通风策略、建筑类型和气候组之间差异很大。这些发现表明 PMV-PPD 模型的预测精度较低,表明需要开发高预测精度的热舒适模型。为了演示,我们开发了一个仅基于气温的简单热预测模型,对于该数据库而言,其准确性高于 PMV。建筑类型和气候组。这些发现表明 PMV-PPD 模型的预测精度较低,表明需要开发高预测精度的热舒适模型。为了演示,我们开发了一个仅基于气温的简单热预测模型,对于该数据库而言,其准确性高于 PMV。建筑类型和气候组。这些发现表明 PMV-PPD 模型的预测精度较低,表明需要开发高预测精度的热舒适模型。为了演示,我们开发了一个仅基于气温的简单热预测模型,对于该数据库而言,其准确性高于 PMV。


 京公网安备 11010802027423号