当前位置:
X-MOL 学术
›
ACS Appl. Mater. Interfaces
›
论文详情
Our official English website, www.x-mol.net, welcomes your
feedback! (Note: you will need to create a separate account there.)
Correction to “Artificial Platelets for Efficient siRNA Delivery to Clear ‘Bad Cholesterol’”
ACS Applied Materials & Interfaces ( IF 8.3 ) Pub Date : 2024-11-19 , DOI: 10.1021/acsami.4c19784 Yanfen Zhang, Yuyan Qin, Huan Li, Qingsheng Peng, Ping Wang, Langyu Yang, Sheng Chen, Ming Li, Jijun Fu, Xiyong Yu, Lingmin Zhang
ACS Applied Materials & Interfaces ( IF 8.3 ) Pub Date : 2024-11-19 , DOI: 10.1021/acsami.4c19784 Yanfen Zhang, Yuyan Qin, Huan Li, Qingsheng Peng, Ping Wang, Langyu Yang, Sheng Chen, Ming Li, Jijun Fu, Xiyong Yu, Lingmin Zhang

|
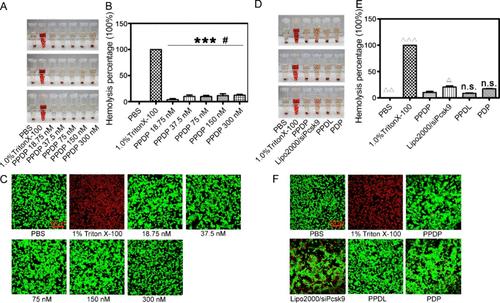
In the original version of this article, Figure 4C contains a typographical error that the confocal laser microscope image at 150 nM is the same as 300 nM, and Figure 5A contains a typographical error that the fluorescence image at 24 h is the same as the one at 48 h in the group of saline. The corrected images are below. The corrections do not affect the conclusions of this work. Figure 4. Hemolysis and cytotoxicity analysis. A) Hemolysis by PPDP at various concentrations. B) Quantitative analysis of the hemolysis rate induced by PPDP (n = 3). C) Live/Dead assay analysis of PPDP-treated cells. D) Hemolysis by different nanoparticles. E) Quantitative analysis of the hemolysis rate induced by different nanoparticles (n = 3). F) Live/Dead assay analysis of different nanoparticle-treated cells. PPDP, PM/PLGA/DOTAP/siPcsk9; PPDL, PM/PLGA/DOTAP/siLuciferase; PPD, PM/PLGA/DOTAP. The green fluorescence represents calcein, and the red one represents PI. Statistically significant differences between different concentrations of PPDP and the positive control Triton X-100 (***P < 0.001); statistically significant differences between different concentrations of PPDP and the negative control PBS (#P < 0.05); statistically significant differences between different samples and PPDP (siRNA equivalent to 150 nM) (ΔP < 0.05, ΔΔP < 0.001, ΔΔΔP < 0.001); n.s., no statistical significance. Figure 5. Biodistribution and circulation of nanoparticles in vivo. A) Biodistribution of nanoparticles in vivo (n = 5). B) The fluorescence intensity of nanoparticles in different organs (n = 5). C) Pharmacokinetic studies of the nanoparticles within 48 h of administration (n = 5). PDP, PLGA/DOTAP/siPcsk9; PPDP, PM/PLGA/DOTAP/siPcsk9. Statistically significant differences between PPDP in different organs and in the livers (***P < 0.001); statistically significant differences between PDP in different organs and in the livers (ΔΔΔP < 0.001); statistically significant differences between PDP and PPDP in the livers (#P < 0.05); n.s., no statistical significance. This article has not yet been cited by other publications.
中文翻译:

更正为“人工血小板用于高效 siRNA 递送以清除'坏胆固醇'”
在本文的原始版本中,图 4C 包含一个印刷错误,即 150 nM 的共聚焦激光显微镜图像与 300 nM 的图像相同,图 5A 包含一个印刷错误,即 24 小时的荧光图像与 48 小时时的荧光图像相同盐水组中的图像。更正后的图像如下。更正不会影响这项工作的结论。图 4.溶血和细胞毒性分析。A) 不同浓度的 PPDP 溶血。B) PPDP 诱导的溶血率定量分析 (n = 3)。C) PPDP 处理的细胞的活/死测定分析。D) 不同纳米颗粒的溶血。E) 不同纳米颗粒诱导的溶血速率的定量分析 (n = 3)。F) 不同纳米颗粒处理细胞的活/死测定分析。PPDP、PM/PLGA/DOTAP/siPcsk9;PPDL、PM/PLGA/DOTAP/siLuciferase;PPD、PM/PLGA/DOTAP。绿色荧光代表钙黄绿素,红色荧光代表 PI。不同浓度的 PPDP 与阳性对照 Triton X-100 之间的统计学显着差异 (***P < 0.001);不同浓度的 PPDP 与阴性对照 PBS 之间的统计学显着差异 (#P < 0.05);不同样品与 PPDP (siRNA 相当于 150 nM) 之间的统计学显着差异 (ΔP < 0.05,ΔΔ P < 0.001,ΔΔΔ P < 0.001);n.s.,无统计学意义。图 5.纳米颗粒在体内的生物分布和循环。A) 纳米颗粒在体内的生物分布 (n = 5)。B) 纳米颗粒在不同器官中的荧光强度 (n = 5)。 C) 给药后 48 小时内纳米颗粒的药代动力学研究 (n = 5)。PDP、PLGA/DOTAP/siPcsk9;PPDP、PM/PLGA/DOTAP/siPcsk9。不同器官和肝脏中 PPDP 之间的统计学显着差异 (***P < 0.001);不同器官和肝脏中 PDP 之间的统计学显着差异 (ΔΔΔP < 0.001);肝脏中 PDP 和 PPDP 之间的统计学显着差异 (#P < 0.05);n.s.,无统计学意义。本文尚未被其他出版物引用。
更新日期:2024-11-19
中文翻译:

更正为“人工血小板用于高效 siRNA 递送以清除'坏胆固醇'”
在本文的原始版本中,图 4C 包含一个印刷错误,即 150 nM 的共聚焦激光显微镜图像与 300 nM 的图像相同,图 5A 包含一个印刷错误,即 24 小时的荧光图像与 48 小时时的荧光图像相同盐水组中的图像。更正后的图像如下。更正不会影响这项工作的结论。图 4.溶血和细胞毒性分析。A) 不同浓度的 PPDP 溶血。B) PPDP 诱导的溶血率定量分析 (n = 3)。C) PPDP 处理的细胞的活/死测定分析。D) 不同纳米颗粒的溶血。E) 不同纳米颗粒诱导的溶血速率的定量分析 (n = 3)。F) 不同纳米颗粒处理细胞的活/死测定分析。PPDP、PM/PLGA/DOTAP/siPcsk9;PPDL、PM/PLGA/DOTAP/siLuciferase;PPD、PM/PLGA/DOTAP。绿色荧光代表钙黄绿素,红色荧光代表 PI。不同浓度的 PPDP 与阳性对照 Triton X-100 之间的统计学显着差异 (***P < 0.001);不同浓度的 PPDP 与阴性对照 PBS 之间的统计学显着差异 (#P < 0.05);不同样品与 PPDP (siRNA 相当于 150 nM) 之间的统计学显着差异 (ΔP < 0.05,ΔΔ P < 0.001,ΔΔΔ P < 0.001);n.s.,无统计学意义。图 5.纳米颗粒在体内的生物分布和循环。A) 纳米颗粒在体内的生物分布 (n = 5)。B) 纳米颗粒在不同器官中的荧光强度 (n = 5)。 C) 给药后 48 小时内纳米颗粒的药代动力学研究 (n = 5)。PDP、PLGA/DOTAP/siPcsk9;PPDP、PM/PLGA/DOTAP/siPcsk9。不同器官和肝脏中 PPDP 之间的统计学显着差异 (***P < 0.001);不同器官和肝脏中 PDP 之间的统计学显着差异 (ΔΔΔP < 0.001);肝脏中 PDP 和 PPDP 之间的统计学显着差异 (#P < 0.05);n.s.,无统计学意义。本文尚未被其他出版物引用。


 京公网安备 11010802027423号