Journal of Ecology ( IF 5.3 ) Pub Date : 2024-06-17 , DOI: 10.1111/1365-2745.14352 Max Zibold 1, 2 , Claus Bässler 3, 4 , Markus Hauck 5 , Michael Scherer‐Lorenzen 1
|
1 INTRODUCTION
The heterogeneity–diversity hypothesis is one of the cornerstones of ecology that explain spatial biodiversity patterns found in nature. According to this hypothesis, an increase in spatial heterogeneity in abiotic and biotic conditions leads to an increase in available niche space, which in turn provides more opportunities for a larger number of species to coexist. The hypothesis goes back to MacArthur and MacArthur (1961), who studied the response of bird species to local vegetation structure, but soon it was transferred to other taxonomic groups, biomes and spatial scales (reviews: Stein et al., 2014; Tews et al., 2004). Today, environmental heterogeneity is regarded as a universal driver of species richness and generally positive relationships seem to be the most frequent, although non-significant, negative and unimodal relationships have also been found (Stein et al., 2014).
During the last two decades, the heterogeneity–diversity hypothesis has been challenged. Today, empirical studies and theoretical works suggest a greater variety of heterogeneity–diversity relationships and that negative or unimodal relationships are much more common than previously thought (e.g. Allouche et al., 2012; Heidrich et al., 2020; Kadmon & Allouche, 2007). The main critique is that the available area should be considered as an equally important driver of species richness, as it largely affects population sizes and, thereby colonialization-extinction dynamics. The area-heterogeneity trade-off hypothesis, therefore, states that there is an inherent trade-off between environmental heterogeneity and the amount of suitable area available per species (Allouche et al., 2012). This trade-off results in a generally unimodal effect of environmental heterogeneity on species richness: While the positive effects of environmental heterogeneity dominate at low levels of heterogeneity, the negative effect of a smaller effective area per species, prevails at high levels of heterogeneity, leading to higher stochastic extinction risks (Figure 1) (Allouche et al., 2012). The strength of this trade-off is expected to be strongly affected by the level of habitat specialization, with specialists being more affected than generalists, because species with a narrow niche are thought to have a higher risk of stochastic extinction in comparison to species with a broader niche (Allouche et al., 2012; McKinney, 1997). However, other factors such as niche position and habitat availability can also affect local species' population sizes (cf. Gaston et al., 1997). And as the proposed mechanism is directly linked to mean abundances, considering rare versus common or dominant species might be more straightforward than comparing specialists versus generalists. Furthermore, as the area-heterogeneity trade-off hypothesis predicts a general unimodal pattern, i.e., a hump-shaped curve, when the full gradient is covered, positive or negative heterogeneity–diversity relationships can be expected in some special cases, for example when only a part of the heterogeneity gradient is covered or when a rare or highly specialized group is studied. Potential reasons for a possibly overlooked unimodal pattern might be inappropriate statistics (e.g. only linear effects were tested), too small data sets (sample size is positively related to statistical power), too short heterogeneity gradients that capture only part of the entire relationship, or publication bias (Allouche et al., 2012; Stein et al., 2014).

Forest ecosystems are ideal systems to study heterogeneity–diversity relationships, as they offer a large variety of complex, three-dimensional structures at different spatial scales and because they harbour several taxonomic groups. Heterogeneity–diversity relationships have been studied in various taxonomic groups, including birds (e.g. Basile et al., 2021; Bersier & Meyer, 1994; MacArthur & MacArthur, 1961; Willson, 1974), mammals (e.g. August, 1983; Ecke et al., 2002; Gorini et al., 2012), arthropods (e.g. Janssen et al., 2009; Knuff et al., 2020; Lassau et al., 2005; Taboada et al., 2010), vascular plants (e.g. Helbach et al., 2022; Pereira et al., 2007) and cryptogams (e.g. Kaufmann et al., 2021; Leutner et al., 2012; Moning et al., 2009; Ranius et al., 2008). Fungi are generally underrepresented in this research area, which is reflected by the neglect of this taxonomic group in the above-mentioned reviews about the heterogeneity–diversity relationships (Stein et al., 2014; Tews et al., 2004). In this study, we focus on deadwood-inhabiting fungi because they are expected to be tightly linked to the heterogeneity of deadwood structures, given that deadwood constitutes their main habitat and, in most cases, also the resource they use. Also, the extremely high number of species, both globally and locally, with estimated fungus-to-plant ratios ranging from 2:1 to 19:1 (Baldrian et al., 2022; Hawksworth & Lücking, 2017) implies a high degree of niche differentiation. These features make deadwood-inhabiting species ideal candidates to study heterogeneity–diversity relationships, as the proposed mechanisms behind the patterns largely refer to the niche concept.
Previous studies, which investigated the effects of deadwood on fungal diversity, can be distinguished according to the examined deadwood characteristics: several ones considered deadwood amounts (usually measured as deadwood volumes), for example to define certain benchmarks below which the occurrence of deadwood-depending species becomes unlikely (Bässler & Müller, 2010; Müller & Bütler, 2010). Other studies addressed the role of specific deadwood characteristics, such as tree species, diameter, or stage of decay on species richness and community composition of deadwood-inhabiting taxa (Bässler et al., 2010; Krah et al., 2018; Lachat et al., 2013; Lassauce et al., 2011). To our knowledge, only few studies combined different aspects of deadwood to calculate measures for deadwood heterogeneity and related that to fungal diversity (Abrego & Salcedo, 2013; Heidrich et al., 2020; Pasanen et al., 2019; Penttilä et al., 2004; Storch, 2018). These studies found either no pattern or positive heterogeneity–diversity relationships. However, deadwood amounts and measures of deadwood heterogeneity (e.g. number of combinations of diameter class, decay class, host tree), are often highly correlated in natural systems (Müller & Bütler, 2010; Siitonen, 2001), which may hamper the interpretation of results. We assume that a positive effect of deadwood amount may mask a possibly unimodal effect of deadwood heterogeneity. Also, the usage of a single number or index for deadwood heterogeneity bears the risk of oversimplification as structural diversity has many facets, just like functional diversity and compositional diversity (Mason et al., 2005; Noss, 1990).
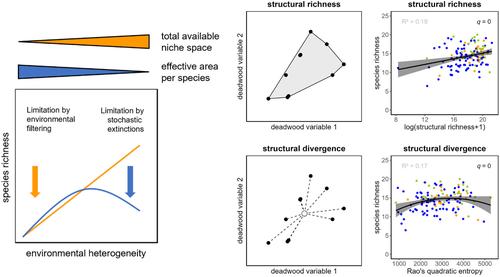
In this study, we explored two main facets of structural diversity of deadwood as measures of spatial heterogeneity: structural richness and structural divergence (Figure 2). For this purpose, we adopted methods from trait-based ecology, i.e., the framework of multidimensional functional diversity (de Bello et al., 2021; Villéger et al., 2008) to compute multidimensional structural diversity indices. We used this approach because it accounts best for the multidimensionality of the ecological niche that is usually imagined as a n-dimensional hypervolume (Hutchinson, 1957). Here, we used deadwood structures on the deadwood object level (corresponding to species traits in the functional diversity framework) and calculated indices based on the sampled deadwood assemblages for each plot. Structural richness was used as a measure of resource niche space, and structural divergence as a measure of multivariate variance within that niche space. We derived two structural diversity indices from the same data set because we expected that studying two indices would provide more detailed insights into the processes underlying heterogeneity–diversity relationships than only a single measure (cf. Stein & Kreft, 2015).

We tested the heterogeneity–diversity hypothesis for wood-inhabiting fungi in temperate forests in Central Europe, and we contrasted it with the more recently stated area-heterogeneity trade-off hypothesis. Our aim was to test the respective predictions: (i) The heterogeneity–diversity hypothesis assumes that the relationship between environmental heterogeneity and species richness is generally positive, while the area-heterogeneity trade-off hypothesis states that this relationship should be unimodal. (ii) The strength of the effect of environmental heterogeneity should depend on the commonness of the respective species, with a stronger response from rare species in comparison to common and dominant species. Although not explicitly stated by the heterogeneity–diversity hypothesis, we expect rare species to respond stronger because we assume that rare species are more often associated with rare structures that are more likely to occur in structurally heterogeneous environments. In addition to the positive effect of environmental heterogeneity due to a higher proportion of likely rare structures, we predict from the area-heterogeneity trade-off hypothesis, that rare species are most negatively affected at high levels of heterogeneity due to highest likelihoods of stochastic extinctions that come with small effective population sizes. (iii) Furthermore, the area-heterogeneity trade-off hypothesis predicts that the mean population size decreases with increasing heterogeneity, because of a decrease in effective area per species, which then results in higher risks of local extinctions. This mechanism is also termed ‘abundance-based extinction’ (Ben-Hur & Kadmon, 2020). In contrast, the classical heterogeneity–diversity hypothesis generates no prediction regarding population sizes since the effect of area per species is also neglected in classical niche theory (Ben-Hur & Kadmon, 2020; Hutchinson, 1957). In addition, to gain a deeper understanding of the importance of single deadwood components and to explicitly evaluate the effect of the different dimensions of deadwood diversity, we performed structural equation modelling, as described below.
中文翻译:
真菌和枯木多样性:面积异质性权衡假设的检验
1 简介
异质性-多样性假说是解释自然界中发现的空间生物多样性模式的生态学基石之一。根据这一假设,非生物和生物条件下空间异质性的增加导致可用生态位空间的增加,这反过来又为更多物种共存提供了更多机会。该假设可以追溯到麦克阿瑟和麦克阿瑟(1961),他们研究了鸟类对当地植被结构的反应,但很快它就被转移到其他分类群、生物群落和空间尺度(评论:Stein et al., 2014;Tews et al., 2014)等,2004)。如今,环境异质性被认为是物种丰富度的普遍驱动因素,尽管也发现了不显着、负向和单峰关系,但总体上正向关系似乎是最常见的(Stein et al., 2014)。
在过去的二十年里,异质性-多样性假说受到了挑战。如今,实证研究和理论著作表明存在更多种类的异质性-多样性关系,并且负向或单峰关系比以前认为的更为常见(例如 Allouche 等人,2012 年;Heidrich 等人,2020 年;Kadmon 和 Allouche,2007 年) )。主要的批评是,可用面积应被视为物种丰富度的同等重要驱动因素,因为它在很大程度上影响种群规模,从而影响殖民-灭绝动态。因此,面积异质性权衡假说指出,环境异质性与每个物种可用的合适面积之间存在固有的权衡(Allouche 等,2012)。这种权衡导致环境异质性对物种丰富度产生普遍的单峰效应:虽然环境异质性的积极影响在低异质性水平下占主导地位,但在高异质性水平下,每个物种有效面积较小的负面影响普遍存在,导致更高的随机灭绝风险(图 1)(Allouche 等,2012)。这种权衡的强度预计将受到栖息地专业化水平的强烈影响,专家比通才受到的影响更大,因为与具有狭窄生态位的物种相比,具有狭窄生态位的物种被认为具有更高的随机灭绝风险。更广泛的利基市场(Allouche 等,2012;McKinney,1997)。然而,其他因素,例如生态位位置和栖息地可用性也会影响当地物种的种群规模(参见 Gaston 等,1997)。 由于所提出的机制与平均丰度直接相关,因此考虑稀有物种与常见或优势物种可能比比较专家与通才更直接。此外,由于面积异质性权衡假设预测了一般的单峰模式,即驼峰形曲线,因此当覆盖完整梯度时,在某些特殊情况下可以预期正或负的异质性-多样性关系,例如当仅涵盖异质性梯度的一部分,或者当研究罕见或高度专业化的群体时。可能被忽视的单峰模式的潜在原因可能是不适当的统计(例如,仅测试了线性效应)、数据集太小(样本量与统计功效正相关)、异质性梯度太短(仅捕获整个关系的一部分),或者发表偏倚(Allouche 等人,2012 年;Stein 等人,2014 年)。
在图查看器中打开PowerPoint
环境异质性对物种丰富度的积极和消极影响的概念框架。异质性-多样性假说(橙色线)预测,总的可用生态位空间以及物种数量会随着环境异质性的增加而增加(橙色三角形)。面积异质性权衡假设(蓝色曲线)预测可用生态位空间与每个物种的有效面积之间的固有权衡,由于随机灭绝率随着环境异质性的增加而增加,从而导致单峰模式(蓝色三角形) 。基于 MacArthur 和 MacArthur (1961) 以及 Allouche 等人的理论工作。 (2012)。图形表示改编自 Allouche 等人并进行修改。 (2012)和海德里希等人。 (2020)。
森林生态系统是研究异质性-多样性关系的理想系统,因为它们在不同的空间尺度上提供了多种复杂的三维结构,并且因为它们拥有多个分类群。异质性-多样性关系已在不同分类群中进行了研究,包括鸟类(例如 Basile 等人,2021 年;Bersier 和 Meyer,1994 年;MacArthur 和 MacArthur,1961 年;Willson,1974 年)、哺乳动物(例如 August,1983;Ecke 等人) ., 2002; Gorini et al., 2012),节肢动物(例如 Janssen et al., 2009; Knuff et al., 2020; Lassau et al., 2005; Taboada et al., 2010),维管植物(例如 Helbach et al., 2010) al.,2022;Pereira 等人,2007)和密码游戏(例如 Kaufmann 等人,2021;Leutner 等人,2012;Moning 等人,2009;Ranius 等人,2008)。真菌在这一研究领域中的代表性普遍不足,这反映在上述关于异质性-多样性关系的评论中对该分类群的忽视(Stein等,2014;Tews等,2004)。在这项研究中,我们关注的是枯木栖息真菌,因为枯木是它们的主要栖息地,并且在大多数情况下也是它们使用的资源,因此预计它们与枯木结构的异质性密切相关。此外,全球和当地的物种数量极高,估计真菌与植物的比例为 2:1 至 19:1(Baldrian 等人,2022 年;Hawksworth 和 Lücking,2017 年),这意味着高度的利基差异化。这些特征使枯木栖息的物种成为研究异质性-多样性关系的理想候选者,因为模式背后提出的机制很大程度上参考了生态位概念。
以前的研究调查了枯木对真菌多样性的影响,可以根据所检查的枯木特征进行区分:一些研究考虑了枯木数量(通常以枯木体积来衡量),例如定义某些基准,低于该基准,枯木的发生取决于物种变得不可能(Bässler & Müller,2010;Müller & Bütler,2010)。其他研究探讨了特定枯木特征的作用,例如树种、直径或腐烂阶段对枯木栖息类群的物种丰富度和群落组成的影响(Bässler 等,2010;Krah 等,2018;Lachat 等.,2013;拉索等人,2011)。据我们所知,只有少数研究结合了枯枝的不同方面来计算枯枝异质性的测量值,并将其与真菌多样性联系起来(Abrego & Salcedo,2013;Heidrich 等,2020;Pasanen 等,2019;Penttilä 等, 2004;斯托奇,2018)。这些研究发现异质性-多样性关系要么没有模式,要么存在正向关系。然而,在自然系统中,枯木数量和枯木异质性测量(例如直径类别、腐烂类别、寄主树的组合数量)通常高度相关(Müller & Bütler,2010;Siitonen,2001),这可能会妨碍对结果。我们假设枯枝数量的积极影响可能掩盖枯枝异质性可能的单峰效应。此外,使用单一数字或指数来表示枯枝异质性存在过于简单化的风险,因为结构多样性有很多方面,就像功能多样性和成分多样性一样(Mason 等,2005;Noss,1990)。
在这项研究中,我们探索了枯木结构多样性的两个主要方面作为空间异质性的衡量标准:结构丰富度和结构分歧(图2)。为此,我们采用基于性状生态学的方法,即多维功能多样性框架(de Bello et al., 2021;Villéger et al., 2008)来计算多维结构多样性指数。我们使用这种方法是因为它最好地解释了生态位的多维性,通常将其想象为 n 维超体积(Hutchinson,1957)。在这里,我们在枯木对象级别上使用枯木结构(对应于功能多样性框架中的物种特征),并根据每个地块采样的枯木组合计算指数。结构丰富度被用作资源利基空间的衡量标准,结构差异被用作该利基空间内多元方差的衡量标准。我们从同一数据集中得出了两个结构多样性指数,因为我们预计研究两个指数将比单一指标更详细地了解异质性-多样性关系背后的过程(参见Stein&Kreft,2015)。
在图查看器中打开PowerPoint
结构丰富度(a)和结构分歧(b)的图形表示,采用基于性状的生态学中使用的功能丰富度和功能分歧的框架。结构丰富度计算为多元极差,结构散度计算为多元方差。对于连续变量,可以使用实际的枯木特征(例如枯木直径和腐烂阶段)。对于连续变量和分类变量的组合,使用 PCoA 轴。改编自 Villéger 等人。 (2008)和德贝洛等人。 (2021)。
我们测试了中欧温带森林中木材栖息真菌的异质性-多样性假说,并将其与最近提出的面积异质性权衡假说进行了对比。我们的目的是检验各自的预测:(i)异质性-多样性假说假设环境异质性和物种丰富度之间的关系通常是正向的,而面积异质性权衡假说指出这种关系应该是单峰的。 (ii) 环境异质性影响的强度应取决于各个物种的共性,与常见和优势物种相比,稀有物种的反应更强。尽管异质性-多样性假说没有明确说明,但我们预计稀有物种的反应会更强,因为我们假设稀有物种更经常与更可能出现在结构异质环境中的稀有结构相关。除了由于可能的稀有结构比例较高而导致环境异质性产生积极影响外,我们根据区域异质性权衡假设预测,由于随机灭绝的可能性最高,稀有物种在高异质性下受到的负面影响最大有效人口规模较小。 (iii) 此外,面积异质性权衡假说预测,平均种群规模随着异质性的增加而减少,因为每个物种的有效面积减少,从而导致局部灭绝的风险更高。这种机制也被称为“基于丰度的灭绝”(Ben-Hur & Kadmon,2020)。 相比之下,经典的异质性-多样性假说无法预测种群规模,因为经典生态位理论也忽略了每个物种面积的影响(Ben-Hur & Kadmon,2020;Hutchinson,1957)。此外,为了更深入地了解单一枯木成分的重要性并明确评估枯木多样性不同维度的影响,我们进行了结构方程建模,如下所述。


 京公网安备 11010802027423号