Diabetologia ( IF 8.4 ) Pub Date : 2024-05-23 , DOI: 10.1007/s00125-024-06179-4 Guy Fagherazzi 1 , Gloria A Aguayo 1 , Lu Zhang 2 , Hélène Hanaire 3, 4 , Sylvie Picard 5 , Laura Sablone 4 , Bruno Vergès 6 , Naïma Hamamouche 7 , Bruno Detournay 8 , Michael Joubert 9 , Brigitte Delemer 10 , Isabelle Guilhem 11 , Anne Vambergue 12 , Pierre Gourdy 3, 13 , Samy Hadjadj 14 , Fritz-Line Velayoudom 15, 16 , Bruno Guerci 17 , Etienne Larger 18, 19 , Nathalie Jeandidier 20 , Jean-François Gautier 21, 22 , Eric Renard 23, 24 , Louis Potier 21, 25 , Pierre-Yves Benhamou 26 , Agnès Sola 19 , Lyse Bordier 27 , Elise Bismuth 28 , Gaëtan Prévost 29 , Laurence Kessler 20 , Emmanuel Cosson 30, 31 , Jean-Pierre Riveline 21, 22 ,
|
Aims/hypothesis
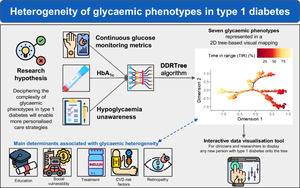
Our study aims to uncover glycaemic phenotype heterogeneity in type 1 diabetes.
Methods
In the Study of the French-speaking Society of Type 1 Diabetes (SFDT1), we characterised glycaemic heterogeneity thanks to a set of complementary metrics: HbA1c, time in range (TIR), time below range (TBR), CV, Gold score and glycaemia risk index (GRI). Applying the Discriminative Dimensionality Reduction with Trees (DDRTree) algorithm, we created a phenotypic tree, i.e. a 2D visual mapping. We also carried out a clustering analysis for comparison.
Results
We included 618 participants with type 1 diabetes (52.9% men, mean age 40.6 years [SD 14.1]). Our phenotypic tree identified seven glycaemic phenotypes. The 2D phenotypic tree comprised a main branch in the proximal region and glycaemic phenotypes in the distal areas. Dimension 1, the horizontal dimension, was positively associated with GRI (coefficient [95% CI]) (0.54 [0.52, 0.57]), HbA1c (0.39 [0.35, 0.42]), CV (0.24 [0.19, 0.28]) and TBR (0.11 [0.06, 0.15]), and negatively with TIR (−0.52 [−0.54, −0.49]). The vertical dimension was positively associated with TBR (0.41 [0.38, 0.44]), CV (0.40 [0.37, 0.43]), TIR (0.16 [0.12, 0.20]), Gold score (0.10 [0.06, 0.15]) and GRI (0.06 [0.02, 0.11]), and negatively with HbA1c (−0.21 [−0.25, −0.17]). Notably, socioeconomic factors, cardiovascular risk indicators, retinopathy and treatment strategy were significant determinants of glycaemic phenotype diversity. The phenotypic tree enabled more granularity than traditional clustering in revealing clinically relevant subgroups of people with type 1 diabetes.
Conclusions/interpretation
Our study advances the current understanding of the complex glycaemic profile in people with type 1 diabetes and suggests that strategies based on isolated glycaemic metrics might not capture the complexity of the glycaemic phenotypes in real life. Relying on these phenotypes could improve patient stratification in type 1 diabetes care and personalise disease management.
Graphical Abstract
中文翻译:
1 型糖尿病血糖表型的异质性
目标/假设
我们的研究旨在揭示 1 型糖尿病的血糖表型异质性。
方法
在法语 1 型糖尿病协会 (SFDT1) 的研究中,我们通过一组补充指标来描述血糖异质性:HbA 1c 、范围内时间 (TIR)、低于范围时间 (TBR)、CV、Gold 评分和血糖风险指数(GRI)。应用判别性降维树(DDRTree)算法,我们创建了表型树,即二维视觉映射。我们还进行了聚类分析以进行比较。
结果
我们纳入了 618 名患有 1 型糖尿病的参与者(52.9% 为男性,平均年龄 40.6 岁 [SD 14.1])。我们的表型树确定了七种血糖表型。二维表型树包括近端区域的主分支和远端区域的血糖表型。维度 1(水平维度)与 GRI(系数 [95% CI])(0.54 [0.52,0.57])、HbA 1c (0.39 [0.35,0.42])、CV(0.24 [0.19,0.28])和TBR (0.11 [0.06, 0.15]),TIR 为负 (−0.52 [−0.54, −0.49])。垂直尺寸与 TBR (0.41 [0.38, 0.44])、CV (0.40 [0.37, 0.43])、TIR (0.16 [0.12, 0.20])、Gold 得分 (0.10 [0.06, 0.15]) 和 GRI 呈正相关 ( 0.06 [0.02, 0.11]),HbA 1c为负值 (−0.21 [−0.25, -0.17])。值得注意的是,社会经济因素、心血管风险指标、视网膜病变和治疗策略是血糖表型多样性的重要决定因素。表型树在揭示 1 型糖尿病患者的临床相关亚组方面比传统聚类具有更大的粒度。
结论/解释
我们的研究增进了目前对 1 型糖尿病患者复杂血糖状况的理解,并表明基于孤立血糖指标的策略可能无法捕捉现实生活中血糖表型的复杂性。依靠这些表型可以改善 1 型糖尿病护理中的患者分层并实现个性化疾病管理。


 京公网安备 11010802027423号