Agriculture, Ecosystems & Environment ( IF 6.0 ) Pub Date : 2024-01-26 , DOI: 10.1016/j.agee.2024.108907
Panos Panagos , Daniele De Rosa , Leonidas Liakos , Maeva Labouyrie , Pasquale Borrelli , Cristiano Ballabio
|
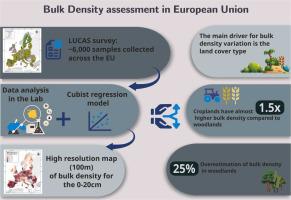
The topsoil Land Use and Cover Area frame Statistical survey (LUCAS) aims at collecting harmonised data about the state of soil health over the extent of European Union (EU). In the LUCAS 2018 survey, bulk density has been analysed for three depths, i.e., 0–10 cm = 6140 sites; 10–20 cm = 5684 sites and 20–30 cm =139 sites. The laboratory analysis and the assessment of the results conclude that the bulk density at 10–20 cm is 5–10% higher compared to 0–10 cm for all land uses except woodlands (20%). In the 0–20 cm depth, croplands have 1.5 times higher bulk density (mean: 1.26 g cm−3) compared to woodlands (mean: 0.83 g cm−3). The main driver for bulk density variation is the land use which implies that many existing pedotransfer rules have to be developed based on land use. This study applied a methodological framework using an advanced Cubist rule-based regression model to optimize the spatial prediction of bulk density in Europe. We spatialised the circa 6000 LUCAS samples and developed the high-resolution map (100 m) of bulk density for the 0–20 cm depth and the maps at 0–10 and 10–20 cm depth. The modelling results showed a very good prediction (R2: 0.66) of bulk density for the 0–20 cm depth which outperforms previous assessments. The bulk density maps can be used to estimate packing density which is a proxy to estimate soil compaction. Therefore, this work contributes to monitoring soil health and refine estimates on carbon and nutrients stocks in the EU topsoil.
中文翻译:
欧洲土壤容重评估
表土土地利用和覆盖面积框架统计调查 (LUCAS) 旨在收集有关欧盟 (EU) 范围内土壤健康状况的统一数据。在LUCAS 2018调查中,对三个深度的堆积密度进行了分析,即0-10厘米= 6140个地点;10–20 cm = 5684 个位点,20–30 cm = 139 个位点。实验室分析和结果评估得出结论,除林地外,所有土地用途的 10-20 厘米容重比 0-10 厘米高 5-10%(20%)。在0-20 cm深度,农田的堆积密度(平均值:1.26 g cm -3)是林地(平均值:0.83 g cm -3)的1.5倍。堆积密度变化的主要驱动因素是土地利用,这意味着许多现有的土壤转移规则必须根据土地利用来制定。本研究应用了一种方法框架,该框架使用先进的基于立体规则的回归模型来优化欧洲堆积密度的空间预测。我们对大约 6000 个 LUCAS 样本进行了空间化,并开发了 0-20 cm 深度的高分辨率堆积密度图 (100 m) 以及 0-10 和 10-20 cm 深度的图。建模结果显示对 0-20 厘米深度的堆积密度的预测非常好(R 2:0.66),优于之前的评估。堆积密度图可用于估计堆积密度,这是估计土壤压实度的代理。因此,这项工作有助于监测土壤健康并完善对欧盟表土碳和养分储量的估计。


 京公网安备 11010802027423号