Atmospheric Environment ( IF 4.2 ) Pub Date : 2023-10-12 , DOI: 10.1016/j.atmosenv.2023.120147 Praveen Kumar , Gufran Beig , Vikas Singh , Saroj K. Sahu , Devendraa Siingh , B.R. Bamniya
|
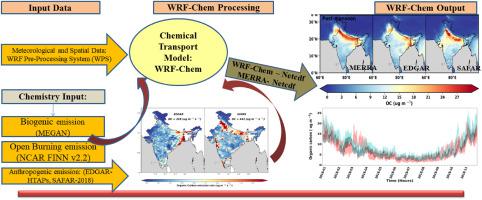
In this study, the evaluation of carbonaceous fine particulate matter (C-PM) was conducted using the SAFAR-India regional model. Two emission inventories were utilized: the newly developed SAFAR inventory and the global EDGAR-HTAP inventory, both for the year 2018. The simulation aimed to capture the seasonal and spatial patterns of black carbon (BC) and organic carbon (OC) concentrations. To validate model results, surface meteorological parameters, and C-PM concentrations were compared with the MERRA reanalysis data for the Indian region. Model simulated surface C-PM concentration with SAFAR emission inventory is found to be slightly overestimated (1.10), whereas simulated results with EDGAR emission inventory is significantly underestimated as compared to MERRA data. Model-simulated meteorological parameters showed a better correlation with MERRA reanalysis. Simulated geographical patterns of seasonal mean C-PM with SAFAR emission inventory exhibit quite a better comparison with MERRA reanalysis as against EDGAR simulated results. However, some differences in the present results are visible, particularly over the IGP region, as compared to MERRA data, but they are mainly attributed to a significant difference in the special resolution of present results (much finer) as compared to coarser MERRA data. In the Indo-Gangetic Plain (IGP) region, the concentration of BCSF and OCSF (BC and OC with SAFAR emission, respectively) show the peak during the winter, followed by the post-monsoon season. Although the correlation coefficients of hourly time series of surface BCSF and OCSF concentrations with MERRA over India are high (0.92 and 0.88), the poor RMSE, is attributed mainly to different scales of resolution. The model simulated BC, and OC concentrations with SAFAR emission input capture the pattern of spatial distribution reasonably well. The present evolution of BC and OC will help to better quantify their impact on climate and atmospheric conditions over the Indian region.
中文翻译:
使用 SAFAR 排放清单对碳质细颗粒物进行模型模拟并与 EDGAR-HTAP 模拟进行比较
在本研究中,使用 SAFAR-印度区域模型对碳质细颗粒物 (C-PM) 进行了评估。使用了两个排放清单:新开发的 SAFAR 清单和全球 EDGAR-HTAP 清单,均为 2018 年。模拟旨在捕获黑碳 (BC) 和有机碳 (OC) 浓度的季节和空间模式。为了验证模型结果,将地面气象参数和 C-PM 浓度与印度地区的 MERRA 再分析数据进行了比较。与 MERRA 数据相比,使用 SAFAR 排放清单进行的模型模拟地表 C-PM 浓度被发现略有高估 (1.10),而使用 EDGAR 排放清单进行的模拟结果则明显低估。模型模拟的气象参数与 MERRA 再分析显示出更好的相关性。与 EDGAR 模拟结果相比,使用 SAFAR 排放清单模拟的季节性平均 C-PM 地理模式与 MERRA 再分析相比表现出更好的比较。然而,与 MERRA 数据相比,当前结果中的一些差异是可见的,特别是在 IGP 区域,但它们主要归因于与较粗糙的 MERRA 数据相比,当前结果的特殊分辨率(更精细)的显着差异。在印度恒河平原(IGP)地区,BC SF和OCSF的浓度在冬季出现峰值,随后是季风后季节。尽管印度地表 BC SF和 OCSF的每小时时间序列与 MERRA 的相关系数很高(0.92 和 0.88),但 RMSE 较差,这主要归因于不同尺度的分辨率。该模型利用 SAFAR 排放输入模拟了 BC 和 OC 浓度,很好地捕捉了空间分布模式。BC 和 OC 目前的演变将有助于更好地量化它们对印度地区气候和大气条件的影响。


 京公网安备 11010802027423号