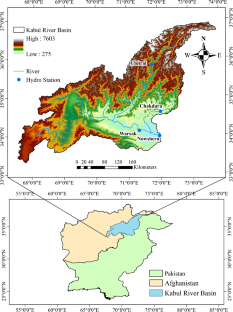
目前的研究调查了喀布尔河流域 (KRB) 季节性和年度尺度的水文气象数据的时空趋势。从国家环境预测中心、气候预报系统再分析 (NCEP-CFSR) 检索了 88 个站点的三十年 (1981–2010) 降水和温度网格化数据。四个水文站(Chitral、Chakdara、Warsak 和 Nowshera)的流量数据由巴基斯坦水电发展局 (WAPDA) 提供。Mann–Kendall 和 Sen 的斜率检验在 5% 的显着性水平下应用以确定趋势。为了避免序列相关对测试结果的影响,应用了无趋势预白化(TFPW)。使用基于地理信息系统的反距离加权方法绘制降水和平均温度的空间图。分别在 92%、93%、86% 和 80% 的网格站确定了冬季、夏季、秋季和每年降水的非显着趋势。63% 的网格站在春季期间观察到显着下降趋势。同样,冬季、春季、夏季和每年的平均温度分别在 74%、60%、79% 和 60% 的网格站中发现了不显着的趋势,而 48% 的网格站在秋天。Chitral 的流量表明冬季有显着增加趋势(和 80% 的网格站,分别。63% 的网格站在春季期间观察到显着下降趋势。同样,冬季、春季、夏季和每年的平均温度分别在 74%、60%、79% 和 60% 的网格站中发现了不显着的趋势,而 48% 的网格站在秋天。Chitral 的流量表明冬季有显着增加趋势(和 80% 的网格站,分别。63% 的网格站在春季期间观察到显着下降趋势。同样,冬季、春季、夏季和每年的平均温度分别在 74%、60%、79% 和 60% 的网格站中发现了不显着的趋势,而 48% 的网格站在秋天。Chitral 的流量表明冬季有显着增加趋势(Z MK = 2.37) 和春季 ( Z MK = 2.40),而在 Chakdara 发现每年和季节性都有显着的增长趋势。秋季期间在 Warsak 检测到显着增加的趋势 ( Z MK = 2.09)。这些发现对水资源管理人员、规划人员、研究人员和水文学家的专业应用很有帮助。
 "点击查看英文标题和摘要"
Spatiotemporal assessment of the hydrometeorology in a transboundary Kabul River Basin
The current study investigated spatiotemporal trends in hydro-meteorological data on seasonal and annual scale in the Kabul River Basin (KRB). Thirty years (1981–2010) precipitation and temperature gridded data of 88 stations were retrieved from National Centers for Environmental Prediction, Climate Forecast System Reanalysis (NCEP-CFSR). Streamflow data of the four hydrometric stations (Chitral, Chakdara, Warsak, and Nowshera) was provided by the Water and Power Development Authority (WAPDA), Pakistan. The Mann–Kendall and Sen’s slope tests were applied at a significance level of 5% to identify trends. To avoid the serial correlation’s effect on the test results, Trend Free Pre-Whitening (TFPW) was applied. Spatial maps of precipitation and mean temperature were prepared using the geographic information system-based Inverse Distance Weighting method. Non-significant trends were identified for precipitation during winter, summer, autumn, and annually at 92%, 93%, 86%, and 80% grid stations, respectively. Significant decreasing trends were observed during the spring at 63% of the grid stations. Similarly, non-significant trends were found for mean temperature during winter, spring, summer, and annually in 74%, 60%, 79%, and 60% grid stations, respectively, while 48% of the grid stations showed significant increasing trends during the autumn. Streamflow at Chitral indicated significant increasing trends during winter (ZMK = 2.37) and spring (ZMK = 2.40), whereas significant increasing trends were found at Chakdara on annual and seasonal basis. Significantly increasing trends were detected at Warsak during autumn (ZMK = 2.09). The findings can be beneficial for water resource managers, planners, researchers, and hydrologists for their professional applications.


 京公网安备 11010802027423号