
Abstract
The increased attention given to batteries has given rise to apprehensions regarding their availability; they have thus been categorized as essential commodities. Cobalt (Co), copper (Cu), lithium (Li), nickel (Ni), and molybdenum (Mo) are frequently selected as the primary metallic elements in lithium-ion batteries. The principal aim of this study was to develop a computational algorithm that integrates geostatistical methods and machine learning techniques to assess the resources of critical battery elements within a copper porphyry deposit. By employing a hierarchical/stepwise cosimulation methodology, the algorithm detailed in this research paper successfully represents both soft and hard boundaries in the simulation results. The methodology is evaluated using several global and local statistical studies. The findings indicate that the proposed algorithm outperforms the conventional approach in estimating these five elements, specifically when utilizing a stepwise estimation strategy known as cascade modeling. The proposed algorithm is also validated against true values by using a jackknife method, and it is shown that the method is precise and unbiased in the prediction of critical battery elements.
Introduction
The global demand for energy is experiencing continuous growth, resulting in an escalation in the use of nonrenewable energy resources, which contribute to the production of greenhouse gases (Liu et al., 2018; Comello & Reichelstein, 2019). The idea of ecologically sound growth, in conjunction with the widespread adoption of the Agreement of Paris on Climate Change, has necessitated the development of innovative, environmentally conscious technologies in the areas of manufacturing, logistics, and power storage (Manthiram, 2020).
The utilization of battery storage systems has emerged as a pivotal measure for mitigating adverse environmental consequences (Crabtree, 2015). The elements necessary for the fabrication of these batteries include Li, Ni, Co, Mo, and Cu (Yu & Manthiram, 2021). The increasing need for lithium-ion batteries in many applications, such as electronics, EV propulsion systems, and energy storage and distribution systems, along with the emphasis on sustainable economic growth in many nations, has resulted in a supply risk in recent years, rendering these elements highly significant. An extensive distribution of these elements can be observed in numerous primary deposits, including copper porphyry deposits (Dolotko et al., 2020). Several studies have modeled the critical elements in primary deposits (e.g., Ilyas et al., 2016; Paithankar and Chatterjee, 2018). Nevertheless, multivariate geostatistical modeling of critical battery elements has received little attention, with the current trend of research mostly focusing on the utilization of secondary deposits, such as tailing storage facilities, for the extraction of these elements. Hence, it is imperative to employ a suitable technique for resource assessment to facilitate the subsequent planning and extraction of these elements from their primary sources.
In fact, improving the resource assessment of these critical battery elements can have significant economic, social, and environmental implications. Accurate resource assessments contribute to a more stable supply chain for critical battery elements. This stability is crucial for industries heavily dependent on these elements, such as electric vehicle (EV) manufacturing and renewable energy. Improved methodologies can lead to more efficient extraction, processing, and recycling of critical battery elements, potentially reducing production costs for batteries. This, in turn, can make renewable energy and EVs more economically viable and accessible.
A growing demand for critical battery elements, driven by advancements in resource assessment methodologies, can lead to job creation in the mining, processing, and recycling sectors. As the cost of critical battery elements decreases, technologies such as EVs and renewable energy solutions may be more broadly available. This can contribute to more widespread adoption of clean and sustainable technologies. Improved resource assessment methodologies can help identify more environmentally friendly extraction and processing methods for critical battery elements. Enhanced resource assessments may also promote better recycling practices for used batteries, reducing the environmental impact of disposal. Accurate resource assessments can stimulate research and development efforts to identify alternative materials or technologies, reducing dependence on scarce resources. A better understanding of critical battery elements can yield advancements in energy storage technologies, improving the efficiency and performance of batteries. Mineral resource evaluation is usually applied to these elements in the same way that it is applied to metallic ores.
In the method typically used for resource estimation, deposits are first split into subareas, known as estimation geo-domains, and the ore grades inside each estimation geo-domain are then estimated or simulated (e.g., Alabert & Massonnat 1990; Haldorsen & Damsleth, 1990; Dubrule, 1993; Boucher & Dimitrakopoulos 2012; Roldão et al., 2012; Jones et al., 2013; Maleki et al., 2020). Given its simplicity, the use of the stepwise (cascade) algorithm for modeling may neglect the interdependence across various ore grades and estimation geo-domains. This could result in a hard boundary that causes a sharp change in ore grade variations as one crosses from one estimation geo-domain to another (Duke & Hanna, 2001; Glacken & Snowden, 2001; Wilde & Deutsch, 2012; Rossi & Deutsch, 2014). Moreover, it is also common that this technique may generate estimates of ore grades that exhibit a gradual transition between two estimation geo-domains, commonly referred to as a soft boundary, regardless of the boundary conditions in the original data (Maleki et al., 2022). Therefore, in this technique, one may not be able to control the reproduction of ore grade variation across the boundaries. To systematically account for the spatial dependence of ore grade crossing boundaries, it is possible to construct a framework that evaluates the intercorrelations among ore grade data within distinct estimation geo-domains (Larrondo et al., 2004; Mery et al., 2017; Ekolle-Essoh et al., 2022). While this approach has the capability to restore the spatial correlation among ore grades in the final outcomes, it might also result in the creation of hard borders. Therefore, the method's viability is dependent upon the presence of soft boundaries (Maleki and Emery, 2020).
Another approach is to use joint simulation when both ore grade and estimation geo-domains can be modeled together (Emery & Silva, 2009; Cáceres & Emery, 2010; Maleki & Emery, 2015). By employing Gaussian random fields, these two features are concurrently modeled. Madani and Maleki (2023) presented an alternative to this method that utilizes two ore grades and two estimation geo-domains to model three Gaussian random fields. Nevertheless, this method is limited to situations containing only soft boundaries. In instances where hard boundaries are present, this approach is not appropriate (Maleki et al., 2021). There are indeed multiple instances in which soft and hard boundaries coexist within a deposit. Madani et al. (2021b) presented a cokriging approach to address this issue when using deterministic modeling of ore grades or estimation geo-domains.
To obtain the proper estimation geo-domains required in joint or cascade simulation, there are two common procedures based on either geological information (e.g., mineralization zones, alteration zones, and rock types) or grade domains in conjunction with geological information (Ortiz and Emery, 2006; Iliyas and Madani, 2021). Nevertheless, these techniques require a significant amount of manual labor, consume a considerable amount of time, and usually rely on subjective human interpretation of the mineral deposits (Fouedjio et al., 2018). Since domaining is a clustering task, an alternative approach is to utilize clustering machine learning methods to find these estimation domains automatically and quickly. For this purpose, one can utilize classic clustering methods such as hierarchical clustering (Maimon et al., 2005), K-means (Jain, 2010), spectral clustering (Jain et al., 1999), and Gaussian mixture (Scrucca et al., 2016; Madenova and Madani, 2021). Geostatistical hierarchical clustering (Romary et al., 2012; Romary et al., 2015) has also received considerable attention (Madani et al., 2022) in such a clustering paradigm.
To acquire estimation domains derived from machine learning, continuous variables (such as ore grades) are customarily fed into clustering-based algorithms. However, there are two issues related to this. First, this technique often fails to consider categorical variables, such as geological data. In addition, this technique may prove unfeasible when handling high-dimensional data, which refer to datasets that contain several variables. One potential solution to this problem is the implementation of dimension reduction process-based techniques. For instance, Koike et al. (2022) utilized principal components analysis (PCA) to obtain estimation geo-domains using both metal content and lithotype data.
In this research paper, a stochastic methodology for modeling the critical battery elements (ore grades of interest) within a porphyry copper deposit is presented considering the dual nature of border effects (hard and soft) within the estimation geo-domains. The method uses a collocated cosimulation technique integrated with a hierarchical cosimulation of ore grades that combines joint and stepwise simulations to accommodate both boundary characteristics in the final resource evaluation results. This technique is henceforth referred to as sequential cosimulation. To obtain the estimation geo-domains, an alternative approach to PCA, namely, factor analysis of mixed data (FAMD), was used in combination with the k-means clustering algorithm. This method allows the inclusion of both ore grade and geological information in the process of obtaining the estimation geo-domains.
The structure of the paper unfolds systematically, beginning with “Methodology” section, which meticulously delineates the research's systematic approach and procedures. “Data (Materials)” section presents a comprehensive case study that serves as the cornerstone of the entire research endeavor. The research outcomes are described in section “Results: stepwise modeling of ore grades and estimation geo-domains,” with specific focus on the revelations emanating from simulation and estimation processes. In “Discussion” section, the results are interpreted and analyzed within the broader context of the research's objectives. Finally, “Conclusions” section encapsulates this paper's essence by summarizing key findings, elucidating their implications, and underscoring the overall contributions of this research to the field.
Methodology
Stepwise Simulation of Estimation Geo-Domains and Ore Grades
The conventional approach to assessing a mineral resource involves initial establishment of estimation geo-domains, followed by the independent estimation of ore grades within each estimation geo-domain (Alabert & Massonnat, 1990; Haldorsen & Damsleth, 1990; Dubrule, 1993; Boucher and Dimitrakopoulos, 2012; Roldão et al., 2012; Jones et al., 2013; Maleki et al., 2020). The approach utilized has been found to be perfectly tailored to circumstances in which hard variations in mean ore grades exists across estimation geo-domain boundaries. This scenario is known as a hard boundary, where there is a sudden and significant shift in the ore grades when transitioning from one estimation geo-domain to an adjacent one.
In the first step, the estimation geo-domains are predicted using explicit or implicit modeling approaches. However, these methods cannot measure the uncertainty of estimation geo-domains in a deposit. The application of geostatistical simulation methodologies, namely, truncated Gaussian simulation approaches (Armstrong et al., 2013; Madani, 2021a, b), is one way of addressing this problem (Emery & González, 2007; Maleki et al., 2022). This method simulates the estimation geo-domains via a truncated Gaussian simulation, which results in a probabilistic description of each estimation geo-domain over each target grid node. Then, only the data from the particular estimation geo-domain are used to estimate ore grade \(i, \{i=1,\dots n\}\), with \(n\) total number of ore grades, using kriging or cokriging (in multivariate cases) across all target grid nodes. In this manner, each grid node \((u)\) provides information on the probability of each estimation geo-domain \({P}_{k}(u)\) and partial estimated ore grade \(s {Y}_{k}^{*}{(u)}^{i}\), \((i=1,\dots ,n)\) that belong to the \({k}^{th}\) estimation geo-domain \((k=1,\dots ,m)\). Consequently, the final estimated ore grade \({Y}^{*}{\left(u\right)}^{i}\) can be obtained from the following equation (Emery & González, 2007; Maleki et al., 2022):
This methodology is based on a stepwise modeling technique that involves the probabilistic definition of estimation geo-domains and estimated ore grades within each estimation geo-domain. This method follows the conventional strategy used in developing a mineral resource model, which is known as cascade modeling. Henceforth, within the context of this study, this methodology will be referred to as the stepwise estimation method.
Stepwise Cosimulation of Estimation Geo-Domains and Ore Grades
The previous methodology involved including the uncertainty of estimation geo-domains over each grid node by simulating the probabilities of these estimation geo-domains. This method yields stochastic models with a pronounced effect on the ultimate estimation of ore grades. This stepwise technique can be further improved by considering the uncertainty associated with ore grades. To achieve this objective, the initial step is similar to that of the stepwise estimation method, employing a simulation technique to replicate several realizations of estimation geo-domains. Following this, ore grades within each estimation geo-domain can be simulated or cosimulated, depending on whether the ore grade is univariate or multivariate. This necessitates one realization of estimation geo-domains for every realization of ore grades. The implementation of this strategy is highly effective when handling hard variations in mean ore grades across estimation geo-domain boundaries. This technique is commonly referred to as cascade simulation. However, its effectiveness diminishes when faced with handling soft variations in mean ore grades. Soft boundaries are, in essence, more adaptable constraints that permit a progressive variation in ore grades between two adjacent estimation geo-domains.
In cases involving soft boundaries, joint simulation (Emery & Silva, 2009; Madani & Maleki, 2023) between ore grades and estimation geo-domains is recommended. The ore grades are subjected to a transformation process, in which they are represented as Gaussian random fields. In the same way, the estimation geo-domains undergo a transformation to be expressed as one or more Gaussian random fields. To accurately capture the joint structure of the ore grades and estimation geo-domains, it is necessary to obtain the cross-correlation structure among these Gaussian random fields. Then, the process of jointly simulating Gaussian random fields is performed over the target grid nodes while accounting for the available borehole data. The Gaussian values obtained from the joint simulation are then back-transformed to represent the ore grades or truncated to the estimation geo-domains. The applicability of this approach is limited by the number of estimation geo-domains and the number of ore grades. The inclusion of more than two ore grades introduces a level of complexity that significantly increases the difficulty of the cross-correlation inference procedure (Madani & Maleki, 2023). In this paper, a methodology for modeling ore grades using a combination of both soft and hard boundaries is introduced.
Proposed Approach
In this work, a technique for addressing the simultaneous presence of soft and hard boundaries in scenarios involving various ore grades is proposed. The approach employed in this study is based on the methodology previously introduced by Almeida and Journel (1994), which involves hierarchical simulation of ore grades. The proposed technique incorporates this hierarchical technique by sorting ore grades based on the presence of soft and hard boundaries. Specifically, the ore grades with soft boundaries are prioritized and arranged before the other ore grades with hard boundaries. This allows the joint simulation to be used for ore grades with soft boundaries, and the simulated values can then be used as collocated data to simulate other ore grades with hard boundaries by a collocated cosimulation approach. The first and second techniques align with the approaches suggested by Emery and Silva (2009) and Almeida and Journel (1994), respectively. Identifying the order of variables to be simulated after considering hard/soft boundary condition involves a combination of geological understanding, spatial analysis, and practical considerations to ensure that the simulated fields are consistent with the known data and reflect the underlying geological processes. Therefore, variables that have a more direct or immediate influence on others in the geological context may be prioritized in the simulation order. In addition, certain geological features or processes may influence the distributions of other variables, guiding the order of simulation. Variables with greater spatial continuity or smoother spatial patterns may be simulated first, providing a foundation for the simulation of variables with more localized or complex structures. Variables that are highly correlated or have known relationships should be simulated in an order that reflects these dependencies, ensuring that the simulated values are consistent with the observed correlations.
The general workflow for modeling multiple ore grades and estimation geo-domains is as follows:
-
(1)
Ore grades are sorted in accordance with the presence of soft and hard boundaries; ore grades exhibiting soft boundaries should be prioritized.
-
(2)
Variogram analysis is performed, and a valid linear model of coregionalizations is obtained using all the ore grades and estimation geo-domains.
-
(3)
The estimation geo-domains and ore grades with soft boundaries are jointly simulated.
-
(4)
The simulated values obtained from step 3 are used as collocated data to simulate the other ore grades with hard boundaries via the collocated cosimulation approach. This should be done in each estimation geo-domain separately following a stepwise/cascade simulation.
-
(5)
The results are postprocessed, and resource estimation for ore grades is implemented.
The proposed methodology is henceforth referred to as the stepwise cosimulation approach. This study employs sequential Gaussian simulation and cosimulation (Journel & Deutsch, 1998) as the primary paradigms for simulation and cosimulation, respectively.
The estimation geo-domains needed for this workflow can be identified by interpreting the geological settings of the deposit, or they can be chosen based on the range of ore grades. The former method based on geological descriptions is suitable when one is handling few estimation geo-domains. However, when the number of estimation geo-domains increases, obtaining proper estimation geo-domains becomes tedious.
To circumvent this problem, a factorial-based transformation approach combined with a machine learning clustering approach is proposed in this study for obtaining proper estimation geo-domains to start the above workflow. To achieve this, first, a factorial transformation based on PCA was used for this dataset for dimension reduction. The high-dimensional dataset in this study encompassed five continuous variables and three categorical variables. The categorical variables covered 13 categories, which, together with continuous variables, make the dataset high-dimensional.
To address this dimensionality problem, a mixed PCA was performed. To do so, the dimension of categorical variables was first reduced based on the frequency of categories and then, combined with continuous variables, these variables were subjected to PCA transformation. This kind of PCA involves both categorical and continuous variables and is referred to as FAMD.
To complete this analysis, the continuous and categorical variables were transformed to normal scores and indicators, respectively. The indicators, however, can only assume binary (0/1) values, which are incompatible with the normal scores of the continuous variables. Consequently, it would be challenging to assign equal weights to all initial variables when calculating the principal components (PCs). To circumvent this issue, to place the variables on the same scale, the indicators were transformed into nearly continuous variables. This was followed by dividing the binary variables by the square root of their probabilities. The final procedure involved centralizing and standardizing the nearly continuous variables to align them with the normal scores of continuous variables. This adjustment was implemented to guarantee that every single variable was standardized and measured on a consistent scale. The methodology is effectively explained in Visbal-Cadavid et al. (2020).
Once the factors were identified via FAMD, any machine learning clustering approach can be used to obtain the estimation geo-domains. Among others, we used k-means clustering, which is an unsupervised learning algorithm that groups similar points and reveals hidden patterns (Jain, 2010); in our case, these patterns revealed the estimation geo-domains. The optimal number of clusters can be identified using the lower value of the Bayesian information criterion (BIC) curve, which tends to fluctuate around a constant (Madenova and Madani, 2021). However, it is often beneficial to combine K-means clustering with geo-domain expertise and other geostatistical techniques to conduct a comprehensive analysis. The flowchart of the technique proposed in this paper is provided in Figure 1.
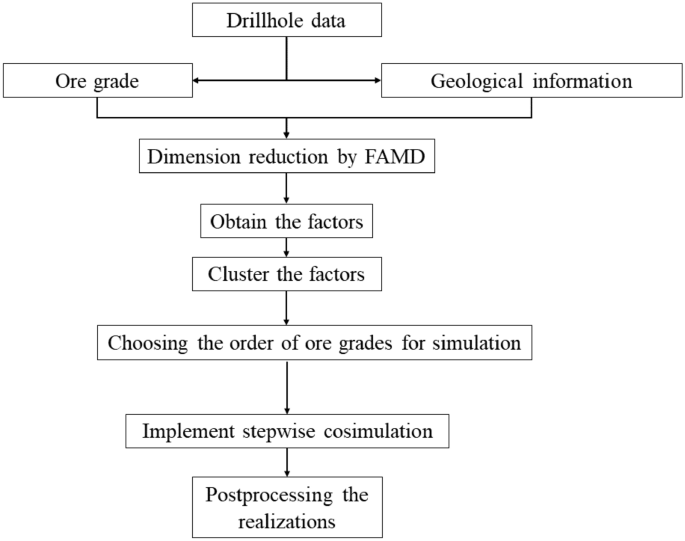
Flowchart showing the steps needed to implement the stepwise cosimulation algorithm
Data (Materials)
Preparation and Exploratory Analysis of the Data
The stepwise algorithms were applied to a dataset comprising 10,994 observations from the Sarkuh copper porphyry deposit in Iran. The geological characteristics of this deposit, including its geological maps and context, have been described in detail in Madani et al. (2022). This dataset encompasses five geochemical ore grade components (Cu, Mo, Ni, Li, and Co) that are of critical importance for battery applications and mineral resource evaluation. Additionally, the dataset includes 13 geo-domains, which encompass various rock types (such as andesite–diorite, granodiorite, and monzodiorite–quartz diorite), mineralization zones (hypogene and supergene), and alteration zones (argillic, carbonatization, chlorotic, phyllic, potassic, propylitic, sericitic, and siliciclastic). An isotopic (homotopic) sampling pattern was utilized, which ensured that each of the elements in the dataset was evaluated simultaneously at the same sampling locations, and no instances of missing values were observed (Wackernagel, 2013). The distribution patterns of the variables at both global and local distributions are illustrated in Figures 2 and 3, employing histograms and location maps. As illustrated in Figure 2, the original dataset exhibits positive skewness for every variable. Lognormality was checked using a probability plot. As shown in Figure 2, the distributions were almost linear for Co, Cu, Li, and Ni and slightly linear for Mo, indicating that all the variables more or less followed a lognormal distribution.

Original ore grade components histograms, and lognormal probability plot

Three-dimensional location maps for Co, Cu, Li, Mo, and Ni
The location maps in Figure 3 illustrate the predominant concentrations of rich ore zones for Cu and Mo within the center of the deposit. Conversely, the rich ore zones for Co, Ni, and Li tended to extend toward the periphery. The drilling pattern spanned an area of roughly 741 m, 599 m, and 633 m in the X, Y, and Z directions, respectively.
The statistical parameters associated with the categorical variables are presented as relative frequencies (Fig. 4). The data reveal that granodiorite exhibits the largest relative frequency (79%) among the many rock types present in the deposit. It is followed by monzodiorite–quartz diorite, which accounted for 20% of the rock types, while andesite–diorite represented a mere 1% of the total alteration zone and exhibited a notable predominance of the potassic group, accounting for a maximum relative frequency of 72%. The dominant mineralization zones were hypogene, constituting 98% of the entire zone, whereas the supergene zone represented a mere 2%.

Relative frequency of geo-domains (rock type, alteration zone, and mineralization zone)
The dataset comprises a five continuous variables that exhibit compositional nature. To mitigate the closure effect that exists within the dataset, we utilized an additive log-ratio transformation (Aitchison, 1986) after introducing a filler variable. Table 1 presents the fundamental univariate statistical parameters for each variable according to their original scale, including sample count, geometric mean, minimum, and maximum. However, the variance was not directly calculated using the original compositional data. Instead, the variance was computed using log-ratio-transformed data, yielding values of 0.157, 0.749, 0.173, 2.463, and 0.1817 for Co, Cu, Li, Mo, and Ni, respectively.
To verify the outcomes of the transformation, an analysis was conducted to assess the interdependence among variables as an indicator of multivariate association, both in the log-ratio and original scales (Table 2). It is evident that the original scale exhibited moderate associations with Co–Li, Co–Ni, and Li–Ni. In addition, the main ore grade, represented by Cu, did not exhibit any significant correlation with the other continuous components. Nonetheless, the correlation coefficients displayed on the original scale may be misleading due to the dataset's compositional structure (Grunsky & Caritat, 2019). Hence, it is advisable to additionally examine the interdependence of variables by evaluating the correlation coefficients after the additive log-ratio transformation. After the additive log-ratio transformation was applied, it was evident that the correlation coefficients exhibited a marginal increase.
To measure the dispersion of ore grades with compositional nature, a variation matrix (Aitchison, 1986) was computed based on the original scale of the data. The variation matrix provides details about the extent and orientation of the distribution of data with multiple variables within a space with multiple dimensions. For example, the variance in Co and Ni exhibited a significantly modest value of 0.16 in the original scale, indicating high positive correlation or proportionality between each of the variables. In contrast, the variance in the original Li and Mo concentrations exhibited a substantial magnitude of 3.59, suggesting a lack of association or a minimal relationship between these two variables (Table 3).
Reduction in Dimension
Dimension reduction is essential owing to the dataset's high-dimensional characteristics (five continuous and three categorical variables, each with multiple categories within every geo-domain). Initially, each of the geo-domains was divided into two main geo-domain groups, depending on the most dominant rock type, mineralization zone, and alteration (Fig. 4). Consequently, the rock varieties were classified as "others" (rock-other) or "granodiorite" (rock-GRD), with monzodiorite–quartz diorite and andesite–diorite comprising the former category. With respect to alterations, a single group was designated the "potassic alteration" (alt-POT), whereas the remaining group (alt-other) comprised the following: argillic, carbonatized, chlorotic, phyllic, propylitic, sericitic, and siliciclastic. Given the limited number of categories present in the mineralized zone, "hypogene" and "supergene" (i.e., min-HYP and min-SUP) were kept constant. The high-dimensional geo-domains were reduced into six main groups using this approach. These main geo-domain groups were converted into indicators, which were subsequently combined with log ratios of ore grades for further analysis via PCA to further reduce the dimensionality of the dataset. This combination helped yield the requisite principle components using FAMD, which was introduced by Visbal-Cadavid et al. (2020). Next, eight standardized and centralized variables were subjected to PCA. Subsequently, eight PCs were obtained, representing the five continuous ore grades and six grouped categorical geo-domains. It is worth noting that the complement of indicators was not considered to avoid singularity in FAMD. The first three PCs were selected for further analysis. The rationale for choosing these three components can be shown by visualizing the scree plot. To visually represent the quantity of variance accounting for each PC, a scree plot was generated. This approach facilitated the assessment of the extent to which variability can be explained by each element. The scree plot demonstrated that the first three PCs, namely PC1, PC2, and PC3, accounted for a significant portion of the variability, exceeding 60%. Specifically, PC1 explained 33.09% of the total variability, followed by PC2 with 15.09% and PC3 with 13.63% (Figure 5). The advantage of this strategy was that the produced PCs incorporate the influences of both ore grades and geo-domains.

Scree plot obtained for 8 variables (mixture of ore grades and geo-domains)
Figure 6 provides a visual representation of the biplot, which is an effective graphic tool for illustrating the relationships among variables in a given dataset and the main components (Jolliffe & Cadima, 2016). The loadings of the normal score log-ratios over PC1 were greater for Cu, Mo, and rock-GRD on the positive side. In contrast, Li, Co, Ni, and alt-POT exhibited higher loadings in PC2, indicating that PC2 more effectively captured the variability of these variables. The PC3 exhibited a notable increase in loading for both the min-HYP and alt-POT variables. In summary, PC1 predominately captured the variance observed in the variables Cu, Mo, and rock-GRD. PC2 predominantly captured the variability in Li, Co, Ni, and alt-POT. Finally, PC3 provided a clearer understanding of the association between min-HYP and alt-POT. In summary, the main factor influencing the variations in Cu and Mo contents was the composition of the rock type, while alterations played a significant role in controlling the variations in Li, Co, and Ni.

Biplots for five ore grades and three geo-domains; Rock, MIN, and Alt represent rock-GRD, min-HYP, and alt-POT, respectively; the continuous variables are normal log-ratio scores
These relationships were corroborated by investigating a correlation matrix (Table 4). PC1 exhibited a robust positive correlation with rock-GRD and a conspicuous negative correlation with Co, Li, and Ni. PC2 exhibited a pronounced positive correlation with Cu and Mo while PC3 exhibited significant correlations with min-HYP and alt-POT. These observations highlight that the ore grades within each group display substantial intercorrelations. However, the absence of a significant correlation between Co-Li-Ni and Cu-Mo is noteworthy.
Inference of Estimation Geo-domains
To determine the estimation geo-domains for modeling purposes, the first three PCs derived from the borehole data were subjected to the K-means clustering algorithm (Figure 7a–c). Within the framework of this technique, it is important to ascertain the predetermined quantity of clusters. Consequently, we designated the number of clusters as two for PC1, PC2, and PC3. Although this might not be the ideal number of clusters, it was helpful in determining the estimation geo-domains that were relevant to this deposit and this study. The clusters obtained from the analysis are illustrated in Figure 7d.

Location maps of a PC1, b PC2, c PC3, and d estimation geo-domains obtained from K-means clustering using PC1, PC2, and PC3
To examine the effectiveness of two inferred estimation geo-domains and their influences on the ore grades and geo-domains, statistical analyses are needed to determine the magnitude of associations with the obtained estimation geo-domains. To assess the relationship between ore grade/geo-domains and inferred estimation geo-domains, Cramer's V coefficient was calculated. This parameter quantitatively measures the dependence between the estimation geo-domains and the geo-domains (i.e., rock types, mineralization zones, and alterations). Cramer's V coefficient can be interpreted as an indicator of the level of association between two variables and can vary between 0 (poor association) and 1 (perfect association) with the following classifications: very weak association (VW; V < 0.05), weak association (W; 0.05 ≤ V < 0.10), moderate association (M; 0.10 ≤ V < 0.15), strong association (S; 0.15 ≤ V < 0.25), and very strong association (VS; 0.25 ≤ V < 1). The Cramer's V coefficient was calculated using the method described by Cramér in 1946.
where \({x}^{2}\) represents test statistics obtained from the summary of the data found in the contingency table, \(q\) is the smaller number of rows and columns in the contingency table, and \(n\) is the total number of sample locations. To measure the dependence between the estimation geo-domains and ore grades in their original scale (Co, Cu, Li, Mo, and Ni), Cramer’s V coefficient was similarly used, and the continuous variables were initially transformed into categorical variables by using thresholds that corresponded to their quartiles. Subsequently, each segment of the quartiles was encoded into integers. The obtained results are presented in Table 5.
The associations of the resulting estimation geo-domains with five ore grades and three geo-domains revealed strong and very strong associations, except for the mineralization zone. The very weak association between the mineralization zone and estimation geo-domains can be attributed to the prevalence of the hypogene zone in this deposit, which outweighs the influence of the supergene zone. Consequently, the inference of estimation geo-domains may not be significantly affected by mineralization zones. This table can also be used to evaluate the level of association between ore grades and estimation geo-domains. As discussed earlier, Li, Ni, and Co exhibited strong correlations with each other, while alteration exhibited a strong association with only Li and Ni. The rock type was found to exert control over all ore grades within this porphyry copper deposit. Therefore, aligning with common practices in resource modeling of copper deposits, the obtained estimation geo-domains appeared to be effective areas for modeling the ore grades in this deposit.
Figure 8 shows the boxplot of the continuous variables on the original scale, along with the resulting estimation geo-domains. Based on the present analysis, the estimation geo-domains can be constructed as follows:
-
Estimation geo-domain 1 was mostly situated in the middle and western regions of the deposit (Fig. 7d). It was distinguished by a substantial quantity of Cu and a somewhat high proportion of Mo. As previously mentioned, the characteristics of this particular estimation geo-domain were shaped primarily by the type of rock present and the occurrence of potassic alteration, which is strongly linked to the hypogene mineralization zone. These characteristics may indicate the existence of a secondary enrichment zone that is generated as a result of the oxidation of primary sulfide minerals. This phenomenon is frequently observed in porphyry copper deposits. Consequently, this field exhibited considerable potential as a source of Cu and Mo.
-
Estimation geo-domain 2 was situated in the eastern-northern peripheral regions of the deposit (Fig. 7d). It is characterized by somewhat elevated levels of Co, Li, and Ni. Hence, this particular area exhibited potential for successful extraction of Co, Li, and Ni.

Boxplots of continuous variables over the original scale
Results: Stepwise Modeling of Ore Grades and Estimation Geo-Domains
Boundary Conditions of Ore Grades Across Estimation Geo-domains
Once the estimation geo-domains are inferred, one obtains the ore grades with log ratios and estimation geo-domains over the borehole data. The analysis of the variation in each component in relation to the distance to the boundary between estimation geo-domains 1 and 2 is necessary for the stepwise prediction and simulation of continuous data. To examine this relationship, a contact analysis was conducted, which organizes the data pertaining to a specific estimation geo-domain and accounts for its proximity to the boundary of another estimation geo-domain. To accomplish this, it is customary to examine the pairings of data points where the tail is associated with one estimation geo-domain and the head is associated with a different estimation geo-domain. The contact analysis can be determined by graphing the average grade of each estimation geo-domain against the distance from the boundary between two estimation geo-domains (Rossi and Deutsch, 2014).
In this study, contact analysis indicates hard boundaries in the distributions of Co, Mo, Ni, and Li when transitioning from estimation geo-domains 1 to 2. However, in the distribution of Cu, this transition appeared to be soft (Fig. 9). Hence, the resource modeling of these five components involved a combination of one soft boundary and four hard boundaries.

Examination of relationships between the signed distance to the boundary separating estimation geo-domains 1 and 2 and the average ore grades; the solid black line represents the boundary between two estimation geo-domains (geo-domain 1 on the left side and geo-domain 2 on the right side of solid black line)
Stepwise Estimation of Ore Grades and Estimation Geo-domains
To implement this algorithm, following the procedure provided in section “Stepwise Simulation of Estimation Geo-Domains and Ore Grades,” initially, a block model of 22,875 blocks, each with dimensions of \(10 {\text{m}}\times 10 {\text{m}}\times 10 {\text{m}}\), was taken into account. Then, the estimation geo-domains were modeled via truncated Gaussian simulation through 100 realizations to quantify the probability of each estimation geo-domain (i.e., \({P}_{1}(u)\) and \({P}_{2}(u)\)) occurring at the designated target blocks. For this purpose, the variogram of the Gaussian random field was inferred using the indicators of the estimation geo-domains over the boreholes. For this purpose, the madogram was evaluated in multiple directions; nevertheless, no discernible zonal or geometric anisotropy was detected (Appendix, Fig. 18). Consequently, an omni-directional cubic variogram structure was fitted with a range of 410 meters. In this study, continuous data were predicted at target locations \({{Y}_{k}}^{*}{(u)}^{i}\), \(\{k=1, 2;i=1,\dots ,5\}\) by using simple collocated cokriging in a hierarchical manner. For this purpose, first, the log ratios of ore grades to borehole data were split into two groups based on their respective estimation geo-domains. Then, the anisotropy was checked by investigating the shape of the experimental madogram in different directions for all the log ratios. The madogram analyses conducted on the provided data did not indicate the presence of any distinct anisotropy in the continuous data within the estimation geo-domains (Appendix, Fig. 18). As a result, direct and cross-variograms that were omnidirectional in each estimation geo-domain were quantified based on the log ratios of ore grades within each estimation geo-domain:
Estimation Geo-Domain 1:
Estimation Geo-Domain 2:
Once the spatial correlation of the log ratios was identified, the log ratios were predicted using a simple collocated cokriging system in a hierarchical manner. This implies that the elements Cu, Co, Li, Mo, and Ni were hierarchically modeled, with Cu being the first element and Ni being the final element in the series. The first criterion for selecting the variables in such an order was the presence of a soft or hard boundary, which was why Cu, with a soft boundary, was prioritized. Given that the dataset in this study was isotopic and exhibited almost identical spatial structures, the order of the variables with hard boundaries (Co, Li, Mo, and Ni) had a minimal impact on the simulation results.
A moving neighborhood with a range of 1000 m and 60 data points was considered for modeling all the variables. Therefore, each block informed seven variables at the end: the probabilities of estimation geo-domains 1 and 2 (\({P}_{1}(u)\) and \({P}_{2}(u))\) and the estimated values of log-ratios \({{Y}_{k}}^{*}{(u)}^{i}\), \(\{k=1, 2;i=1,\dots ,5\}\). To use Eq. 1 to obtain the final prediction of ore grades, the predicted values were back-transformed from log ratios to the original scale. Afterward, the multiplication in Eq. 1 was accounted for. This method considers the influences of both estimation geo-domains. Two realizations of truncated Gaussian simulation and one realization of ore grades are presented in Figures 10 and 11. The scenarios generated using the truncated Gaussian simulation approach in Figure 10 corresponded with the variance in the categorical variable observed in the borehole data. However, the outcomes obtained were somewhat patchy in nature. In addition, ore grade fluctuations across the estimation geo-domain boundaries were relatively smooth (Fig. 11). The use of the kriging paradigm for stepwise estimation of ore grades was a significant cause of such smoothness. These results present the traditional modeling of ore grades where the estimation geo-domains were modeled first and the ore grades were then estimated independently in each estimation geo-domain.

Two realizations (a and b) of stepwise cosimulation (left column) and stepwise estimation methods (right column)

One realization and estimated map of stepwise cosimulation (left) and stepwise estimation (right) methods for a Cu, b Co, c Li, d Mo, and e Ni
Stepwise Cosimulation of Ore Grades and Estimation Geo-domains
In the studied deposit, as shown in Figure 9, there is a mixture of hard and soft boundaries. The methodology employed in this research was the cosimulation of ore grades, with particular emphasis on the incorporation of the aforementioned contact behaviors. For this purpose, a hierarchical manner of simulation was considered. To do so, first, the Cu and estimation geo-domains were jointly simulated following the approach proposed by Emery and Silva (2009), which accounts for the presence of a soft boundary in the Cu variation (Fig. 9). Then, the other ore grades, Co, Li, Mo, and Ni, were cosimulated hierarchically, with Co being the first element and Ni being the final element in this series. Because the variations in Co, Li, Mo, and Ni exhibited hard boundaries (Fig. 9), the dataset was then split into two groups, each belonging to one estimation geo-domain. This property of ore grade variation encourages the use of stepwise/cascade simulation.
Variogram Analysis
Because joint and cascade simulations were both considered in this study, proper variogram inference was needed. In joint simulations, a linear model of coregionalization should be inferred between Cu and the estimation geo-domains. In cascade simulations, linear models of coregionalization should be inferred for Co, Li, Mo, and Ni in each estimation geo-domain separately. However, because the proposed hierarchical approach in this study also necessitates considering the spatial cross-correlations among Cu and Co, Li, Mo, and Ni, a particular solution must be examined. To do so, first, the variogram analysis of the Gaussian random field, used in the previous step for implementing the truncated Gaussian simulation, was considered. This is a one-structure cubic variogram with a range of 410 m. Then, Cu and Co, Li, Mo, and Ni in each estimation geo-domain were first transformed into log-ratios and then converted to normal scores. Notably, the entire dataset of Cu was utilized without accounting for any differentiation across estimation geo-domains. The spatial continuity analyses were conducted omni-directionally because no discernible anisotropy was observed in the madogram analyses. A linear model of coregionalization was then inferred for the two estimation geo-domains separately, taking into consideration that the Cu values are identical in these two dataset groups:
Estimation Geo-Domain 1:
Estimation Geo-Domain 2:
Once the linear model of coregionalization was identified, the same structure of Cu (Eqs. 5 and 6) was considered, as was the previously inferred variogram of Gaussian random fields. An experiment was conducted to evaluate the similarity in structure between Cu in estimation geo-domains 1 and 2. As suggested by Emery and Silva (2009) and Madani and Maleki (2023), possible cross-variograms with normal log ratios of Cu and indicator of estimation geo-domains were subsequently derived via a combination of trial and error and Monte Carlo simulation, thus:
Geostatistical Simulation
Prior to implementing the proposed cosimulation algorithm, an evaluation is required to assess the assumption of multi-Gaussianity and bivariate normality using the normal score values. The rationale for this is that the sequential Gaussian cosimulation approach we propose here requires these assumptions to be validated in the transformed variables. To accomplish this, the spatial multi-Gaussianity of the transformed data was evaluated by examining the experimental variogram of various orders using normal score variables as proposed by Emery (2005). The validation results confirmed the presence of spatial multi-Gaussianity for all five critical elements. Hence, the normal scores of the initial data can be employed for any multi-Gaussian cosimulation procedure, including sequential Gaussian cosimulation.
Once the direct and cross-variograms were fitted properly, a stepwise simulation was chosen as explained above. First, normal scores of the log ratios of Cu and the estimation geo-domains were jointly simulated using the model fitted in Eq. 7. Then, simulated values of Cu at target locations (normal scores) were chosen as collocated data to hierarchically simulate 100 realizations of Co, Li, Mo, and Ni in each estimation geo-domain separately using the variogram model derived as in Eqs. 5 and 6. For each realization of the estimation geo-domains, there is one realization of the continuous variables. The normal scores were then back-transformed to log-ratios and to the original scale of the data. Therefore, six simulated variables were available at each block: the estimation geo-domains, Cu, Co, Li, Mo, and Ni. Figure 10 shows two realizations of the truncated Gaussian simulation. The estimation geo-domains, particularly the second one, appeared to be more contiguous and compact in the stepwise simulation results than in the stepwise estimation results. This phenomenon occurred as a result of the inclusion of Cu within the simulation of the estimation geo-domains. One realization of stepwise cosimulation for each ore grade is presented in Figure 11. The cosimulations were less smooth than the stepwise estimation results were.
Postprocessing of Realizations and Statistical Validations
The probability maps in each block were calculated by considering the outcomes of the truncated Gaussian simulation from both methodologies. For this purpose, the probability of each block being either 1 or 2 was calculated based on 100 realizations. The probability maps of estimation geo-domain 2 obtained from both approaches are presented in Figure 12. It is evident that there is a considerable likelihood of encountering estimation geo-domain 2 in the western-northern region of the deposit. This observation indicates a notable abundance of Co, Li, and Ni within these regions. In the context of estimation geo-domain 1, the likelihood of the presence of this estimation geo-domain is significantly elevated in the central and eastern sections of the deposit (opposite to estimation geo-domain 2). This observation indicates a notable concentration of Cu and Mo in these particular areas. The likelihood of encountering estimation geo-domain 2 in these regions is relatively low. However, it is apparent that the distinction between the two methodologies is not substantial. It is important to highlight that the initial proportions were effectively replicated using both approaches, as indicated in Table 6.

Probability maps of (a) stepwise cosimulation and (b) stepwise estimation
For the ore grades, examining the reproduction of original distribution obtained from both methods is of interest. Figure 13 shows probability plots for the results obtained from both approaches (the realization and final estimation maps are presented in Figure 11). These plots were compared with the original distribution of the ore grades. The upper tail of the distribution is significant because it represents valuable parts of a deposit. However, the smoothing effect of the final results obtained from stepwise estimation can be observed clearly, particularly when reproducing the upper quartiles of the original distribution for all five ore grades, while the distribution of the results obtained from stepwise cosimulation was more consistent with the original distribution. This discrepancy is related to the use of the kriging method in stepwise estimation.

Probability plots of the original ore grade (blue circles), stepwise estimation (black circles), and stepwise cosimulation (red circles). The latter two were obtained from the maps presented in Fig. 11
Additionally, the replication of the correlation coefficient in the dataset's original scale was considered (Fig. 14). The implementation was conducted on the Co–Ni, Co–Li, and Li–Ni pairs due to their modest correlations (Table 2). The findings suggest that the stepwise cosimulation method replicated more accurately the original correlation coefficients than did the stepwise prediction approach, which notably overestimated this parameter. This could perhaps be associated with the cokriging mechanism employed in the stepwise estimation approach. In some cases, the spatial structures of the variables may be more complex than what the cokriging model can capture via variogram analysis. Moreover, when variables exhibit nested variability (variation at multiple scales), cokriging may struggle to capture these patterns accurately, which may lead to overestimation or underestimation of the original correlation coefficients. Another reason may be related to the inevitable smoothing effect of the cokriging paradigm.

Reproduction of correlation coefficients for the pairs of a Co–Ni, b Co–Li, and c Li–Ni for stepwise cosimulation (red lines), stepwise estimation (black line), and original ore grades (blue line)
The final phase in the postprocessing of ore grades entails examining the recoverable functions. The primary objective of such functions is to determine the tonnage and average grade that can be extracted at a designated cutoff grade (Maréchal, 1984). After calculating the recovery functions over multiple realizations, the outcomes of a stepwise cosimulation are averaged at each cutoff grade. The acquired results were subsequently compared with the curve derived from stepwise estimation for Cu (Fig. 15). The dissimilarity in outcomes can be attributed to the influence of the smoothing effect observed in cokriged maps. Hence, the models derived via stepwise cosimulation exhibited more reliability, as evidenced by the superior statistical parameters in comparison with those of stepwise estimation. These contours were also examined for other ore grades; however, the resulting graphs are not shown to conserve space here. These graphs exhibited nearly identical disparities.

Tonnage curves for Cu: mean grade (right), and tonnage (left). Red line: stepwise cosimulation; black line: stepwise estimation
To examine the reproduction of ore grade variabilities across the estimation geo-domains, contact analysis is performed over one realization. The contact relationships of the ore grades throughout the estimation geo-domains were reproduced accurately via stepwise cosimulation for Cu (soft boundary) and the other ore grades (hard boundaries). Nevertheless, the findings derived from the stepwise estimation indicated that the fluctuations in ore grade were uniformly soft over the boundaries, a characteristic that holds true only for Cu but not for other types of ore grades. This could be attributed to the inherent property of the cokriging system, specifically its ability to produce a smoothing effect throughout the stepwise estimation process. For stepwise cosimulation, the curves of contact analysis followed the same trends and conditions of the hard/soft boundaries; however, they also appeared to be smooth in some parts. This may be related to the grid resolution and cell size, which in this study were relatively coarse, and so fine-scale features, such as narrow contacts, might be averaged across neighboring cells. The stepwise cosimulation thus tended to provide a more generalized or smoothed representation of the actual variation in ore grades across estimation geo-domains 1 and 2 (Fig. 16).

Contact analysis of one realization obtained from stepwise cosimulation (left column), final map obtained from stepwise estimation (middle column), and original ore grades (right column); solid black line is the boundary between two estimation geo-domains
Validation of Outcomes
To assess the trustworthiness of the proposed method, a jackknife method (Deutsch and Journel, 1998) was applied to the simulated ore grades using the described stepwise cosimulation technique. For this purpose, the dataset was randomly split into two groups comprising the training and testing dataset, which contained 70% and 30% of the data, respectively. The proposed method was utilized to simulate the ore grades and estimation geo-domains across the testing data using the training data. The obtained findings were subsequently contrasted against the actual values across the designated test observations. In this context, a scatterplot was employed to juxtapose the actual and predicted values, with the latter being the average of the simulation results (Fig. 17a). The finding that the conditional mean tended toward the identity implies that the average of the simulated outcomes exhibited both conditional unbiasedness and accuracy. Another component that should be considered is the evaluation of symmetric probability intervals for each test observation, commonly referred to as the accuracy plot (Deutsch, 1996). The graph in Figure 17b illustrates a satisfactory level of agreement between the observed and expected proportions of the probabilities. This is evident from the fact that a portion of the probability intervals encompassed the actual ore grades. Table 7 also shows the error indicators (RMSE, RE, and ME) yielded by the stepwise cosimulation algorithm, calculated via jackknife validation. The errors were all small, indicating that the algorithm was implemented properly. To save space, the results of stepwise estimation are not provided here; however, they were checked, and it was verified that the estimation results were accurate and conditionally unbiased.

a Jackknife validation: scatterplots between the ore grades and the average of simulation results; the red plots represent the conditional mean. b Accuracy plots comparing the proportion of test data versus nominal interval probability
Discussion
For modeling, the algorithm proposed in this study employs sequential Gaussian simulation and cosimulation. This is because these simulation algorithms capture the complexity of geological structures and the variation in ore grades, thereby enabling more realistic simulations. In addition, these algorithms exhibit greater adaptability in accommodating non-Gaussian distributions and permit the inclusion of numerous correlated variables. Additionally, the efficacy of these algorithms in managing both hard and soft constraints is demonstrated.
However, when the variogram's origin is parabolic, the algorithms may prove impractical. The simulation is incapable of reproducing accurate values in this instance. To overcome this difficulty, it is possible to use simulation methods such as turning bands simulation and cosimulation (Emery, 2008) for this purpose.
In this study, a K-means clustering algorithm was used to obtain the estimation geo-domains of the factors. The reasons were as follows: K-means is easy to implement and interpret, which is advantageous for geologists who may not have extensive machine learning expertise and enables accessibility through several software programs; K-means is computationally efficient and scalable, which is crucial when handling large geological datasets; and K-means allows for iterative refinement by adjusting the number of clusters (K) or modifying the features used in clustering. This flexibility is valuable in refining geological estimation geo-domains based on ongoing insights and geo-domain knowledge.
In this research, the geological variables were transformed into indicators, and together with FAMD, they were summarized as PCs. Then, the PCs were simulated. Because the binary variables were also compositional, an alternative method is to skip the FADM and implement the cosimulation directly over the log-ratio data and indicators. However, the back-transformation from simulated values to the original scale of indicators is not trivial and requires further investigation. The Gibbs sampler (Geman and Geman, 1984) could be an alternative for this purpose.
The choice of grid resolution in spatial simulations has a critical impact on the level of detail captured in the contact analysis results. A coarse grid may lead to a smoothing effect, averaging out fine-scale features, while a finer grid enables a more accurate representation of intricate ore grade variations across the estimation geo-domains. A trade-off exists between the computational efficiency and the ability to capture fine-scale details, and the appropriate resolution depends on the specific characteristics and objectives of the simulation.
Conclusions
In this study, the critical battery elements and geological information of a porphyry copper deposit were considered for resource modeling. K-means clustering was applied to identify the estimation geo-domains over the PCs obtained from the critical battery elements and the simplified geological information. The application of K-means yielded satisfactory results in discriminating between two estimation geo-domains, indicating that the clustering of ore grades was conducted effectively. The simulation results obtained using the stepwise cosimulation strategy were compared with the simulation results produced through traditional modeling of ore grades, which considered a stepwise estimation technique. The results of the statistical validation investigations indicate that stepwise cosimulation yields stronger reproduction of global statistical parameters, including the mean, variance, and correlation coefficient. In conclusion, the comparison between stepwise estimation and stepwise cosimulation reveals distinct patterns in the characteristics of the obtained realizations and their impacts on various aspects of the estimation process. The realizations derived from stepwise estimation exhibit greater scatter within the estimation geo-domains compared to those obtained through stepwise cosimulation. Despite this difference, both methods demonstrate similar capabilities in reproducing the original proportion of estimation geo-domains and generating comparable probability maps. Notably, the application of stepwise cosimulation significantly enhances the reproduction of the original correlation, with improvements ranging from approximately 30% to 80% when compared to stepwise estimation. This suggests that the cosimulation approach contributes to a more accurate representation of the correlation structure within the estimation geo-domains. Jackknife validation, a crucial aspect of assessing methodological performance, indicates that both stepwise estimation and stepwise cosimulation exhibit similar levels of accuracy and conditional unbiasedness. This finding indicates that both methods can be relied upon for robust estimation. Furthermore, the reproducibility of the original distribution substantially improves stepwise co-simulation, achieving levels ranging from 90% to 100%. This highlights the effectiveness of cosimulation in capturing the true distribution characteristics, as the results obtained by cosimulation outperformed those obtained by stepwise estimation. A noteworthy observation in tonnage estimation reveals that stepwise cosimulation leads to a notable increase of approximately 30–60% for higher cutoffs. Conversely, it yielded a significant decrease of around 40–75% for lower cutoffs compared to stepwise estimation. This underscores the impact of the chosen method on tonnage estimates and suggests that cosimulation may yield more accurate and refined results, particularly in the context of different cutoff thresholds. The analysis of local statistical parameters, such as contact analysis, also demonstrated that the proposed method, stepwise co-simulation, is effective in managing both soft and hard boundaries. In contrast, the stepwise estimation method yielded only soft boundaries, regardless of whether the specified boundary conditions were soft or hard. To obtain the estimation geo-domains, an alternative factor-based technique is proposed in this study, involving the use of FAMD with the K-means classic machine learning algorithm. This approach incorporates both continuous (e.g., ore grades) and categorical (e.g., geological data) variables to obtain decorrelated factors. The effectiveness of the proposed technique showed that dimension reduction using FAMD can enhance the results of the clustering step.
In summary, while both stepwise estimation and stepwise cosimulation exhibit similar performances in certain aspects, such as original proportion reproduction and probability maps, the latter method proves superior in reproducing the correlation, original distribution, and tonnage estimates across various cutoff thresholds. These findings affirm the efficacy of stepwise cosimulation as a more robust and accurate approach for the estimation of spatial phenomena. The identified methodological differences between stepwise estimation and stepwise cosimulation have significant implications for resource estimation in practical mining scenarios. The observed improvements in the reproductions of the correlation, original distribution, and tonnage estimates with stepwise cosimulation suggest that this approach may offer a more accurate representation of the spatial characteristics of ore deposits. In practical mining applications, where precision in estimating resource quantities is paramount for decision-making, the enhanced performance of cosimulation is particularly valuable. These findings prompt a re-evaluation of current resource estimation practices, encouraging the adoption of cosimulation methodologies to potentially improve the reliability and accuracy of estimates. Furthermore, considering the generalizability of these results to other ore deposit types is crucial. While this study specifically addresses certain conditions, the demonstrated benefits of stepwise cosimulation may translate to diverse geological settings, warranting exploration and application in a broader range of mining contexts. This exploration of broader implications underscores the potential for methodological advancements to positively impact resource estimation practices across the mining industry.
The proposed methodology may be tedious when inferring the linear model of coregionalizations when the number of ore grades is high. In this case, factorial simulation methods can be used as an alternative.
References
Aitchison, J. (1986). The statistical analysis of compositional data. Journal of the Royal Statistical Society: Series B (Methodological), 44(2), 139–160.
Alabert, F. G., & Massonnat, G. J. (1990). Heterogeneity in a Complex Turbiditic Reservoir: Stochastic Modelling of Facies and Petrophysical Variability. All Days. https://doi.org/10.2118/20604-ms
Almeida, A. S., & Journel, A. G. (1994). Joint simulation of multiple variables with a Markov-type coregionalization model. Mathematical Geology, 26(5), 565–588.
Armstrong, M., Galli, A., Beucher, H., Gaelle Loc'h, Renard, D., Doligez, B., Remi Eschard, & Francois Geffroy. (2013). Plurigaussian Simulations in Geosciences. Springer Science & Business Media.
Benjamini, Y. (1988). Opening the Box of a Boxplot. The American Statistician, 42(4), 257–262.
Boucher, A., & Dimitrakopoulos, R. (2012). Multivariate Block-Support Simulation of the Yandi Iron Ore Deposit. Western Australia. Mathematical Geosciences, 44(4), 449–468.
Cáceres, A., & Emery, X. (2010). Conditional co-simulation of copper grades and lithofacies in the Rio Blanco-Los Bronces copper deposit. Proceedings of the IV international conference on mining innovation MININ 2010. Santiago, Chile, 311–320.
Comello, S., & Reichelstein, S. (2019). The emergence of cost effective battery storage. Nature Communications, 10(1), 2038.
Crabtree, G. (2015). Perspective: The energy-storage revolution. Nature, 526(7575), S92.
Cramér, H. (1999). Mathematical methods of statistics. Princeton University Press.
Deutsch, C. V., & Journel, A. G. (1998). GSLIB. Oxford University Press.
Deutsch, C.V. (1997). Direct assessment of local accuracy and precision. Geostatistics Wollongong’ 96. Kluwer, Dordrecht, 115–125.
Dolotko, O., Hlova, I. Z., Mudryk, Y., Gupta, S., & Balema, V. P. (2020). Mechanochemical recovery of Co and Li from LCO cathode of lithium-ion battery. Journal of Alloys and Compounds, 824, 153876.
Dubrule, O. (1993). Introducing more geology in stochastic reservoir modelling. Quantitative geology and geostatistics, 351–369. https://doi.org/10.1007/978-94-011-1739-5_29
Duke, J.H., & Hanna, P.J. (2001). Geological interpretation for resource modelling and estimation. Mineral Resource and Ore Reserve Estimation – the AusIMM Guide to Good Practice. Melbourne, Australia, 147–156.
Ekolle-Essoh, F., Meying, A., Zanga-Amougou, A., & Emery, X. (2022). Resource Estimation in Multi-Unit Mineral Deposits Using a Multivariate Matérn Correlation Model: An Application in an Iron Ore Deposit of Nkout. Cameroon. Minerals, 12(12), 1599.
Emery, X. (2008). A turning bands program for conditional co-simulation of cross-correlated Gaussian random fields. Computers & Geosciences, 34(12), 1850–1862.
Emery, X., & González, K. (2007). Incorporating the uncertainty in geological boundaries into mineral resources evaluation. Journal of the Geological Society of India, 69(1), 29–38.
Emery, X., & Silva, D. A. (2009). Conditional co-simulation of continuous and categorical variables for geostatistical applications. Computers & Geosciences, 35(6), 1234–1246.
Fouedjio, F., Hill, E. J., & Laukamp, C. (2018). Geostatistical clustering as an aid for ore body domaining: case study at the Rocklea Dome channel iron ore deposit. Western Australia. Applied Earth Science, 127(1), 15–29.
Geman, S., & Geman, D. (1984). Stochastic relaxation, Gibbs distributions, and the Bayesian restoration of images. IEEE Transactions on pattern analysis and machine intelligence, 6, 721–741.
Glacken, I.M., & Snowden, D.V. (2001). Mineral Resource Estimation. Mineral Resource and Ore Reserve Estimation – the AusIMM Guide to Good Practice. Melbourne, Australia, 89–198.
Grunsky, E. C., & Caritat, P. D. (2019). State-of-the-art analysis of geochemical data for mineral exploration. Geochemistry: Exploration, Environment, Analysis, 20(2), 217–232.
Haldorsen, H. H., & Damsleth, E. (1990). Stochastic Modeling. Journal of Petroleum Technology, 42(04), 404–412. https://doi.org/10.2118/20321-pa
Iliyas, N., & Madani, N. (2021). An enhanced co-simulation technique for resource modelling using grade domaining: a case study from an iron ore deposit. Applied Earth Science, 130(2), 81–106.
Ilyas, A., Kashiwaya, K., & Koike, K. (2016). Ni grade distribution in laterite characterized from geostatistics, topography and the paleo-groundwater system in Sorowako, Indonesia. Journal of Geochemical Exploration, 165, 174–188.
Jain, A. K. (2010). Data clustering: 50 years beyond K-means. Pattern recognition letters, 31(8), 651–666.
Jain, A. K., Murty, M. N., & Flynn, P. J. (1999). Data clustering: a review. ACM computing surveys (CSUR), 31(3), 264–323.
Jolliffe, I. T., & Cadima, J. (2016). Principal component analysis: A review and recent developments. Philosophical Transactions of the Royal Society A: Mathematical, Physical and Engineering Sciences, 374(2065), 20150202.
Jones, P., Douglas, I., & Jewbali, A. (2013). Modeling combined geological and grade uncertainty: Application of multiple-point simulation at the Apensu Gold Deposit. Ghana. Mathematical Geosciences, 45(8), 949–965.
Koike, K., et al. (2022). Incorporation of geological constraints and semivariogram scaling law into geostatistical modeling of metal contents in hydrothermal deposits for improved accuracy. Journal of Geochemical Exploration, 233, 106901.
Larrondo, P., Leuangthong, O., & Deutsch, C.V. (2004). Grade estimation in multiple rock types using a linear model of coregionalization for soft boundaries. Proceedings of the First International Conference on Mining Innovation. Gecamin Ltda, 187–196.
Liu, J., Hull, V., Godfray, H. C. J., Tilman, D., Gleick, P., Hoff, H., Pahl-Wostl, C., Xu, Z., Chung, M. G., Sun, J., & Li, S. (2018). Nexus approaches to global sustainable development. Nature Sustainability, 1(9), 466–476.
Madani, N., & Maleki, M. (2023). Joint simulation of cross-correlated ore grades and geological domains: an application to mineral resource modeling. Frontiers of Earth Science, 17, 417–436.
Madani, N., Maleki, M., & Sepidbar, F. (2021a). Application of geostatistical hierarchical clustering for geochemical population identification in Bondar Hanza copper porphyry deposit. Geochemistry, 81(4), 125794.
Madani, N., Maleki, M., & Sepidbar, F. (2021b). Integration of dual border effects in resource estimation: A cokriging practice on a copper porphyry deposit. Minerals, 11(7), 660.
Madani, N., Maleki, M., & Soltani-Mohammadi, S. (2022). Geostatistical modeling of heterogeneous geo-clusters in a copper deposit integrated with multinomial logistic regression: An exercise on resource estimation. Ore Geology Reviews, 1, 105132.
Madenova, Y., & Madani, N. (2021). Application of Gaussian mixture model and geostatistical co-simulation for resource modeling of geometallurgical variables. Natural Resources Research, 30, 1199–1228.
Maimon, O., & Rokach, L. (2005). Decomposition methodology for knowledge discovery and data mining (pp. 981–1003). Springer.
Maleki, M., & Emery, X. (2015). Joint simulation of grade and rock type in a stratabound copper deposit. Mathematical Geosciences, 47, 471–495.
Maleki, M., & Emery, X. (2020). Geostatistics in the presence of geological boundaries: Exploratory tools for contact analysis. Ore Geology Reviews, 120, 103397.
Maleki, M., Madani, N., & Jélvez, E. (2021). Geostatistical algorithm selection for mineral resources assessment and its impact on open-pit production planning considering metal grade boundary effect. Natural Resources Research, 30(6), 4079–4094.
Maleki, M., Mery, N., Soltani-Mohammadi, S., Khorram, F., & Emery, X. (2022). Geological control for in-situ and recoverable resources assessment: A case study on Sarcheshmeh porphyry copper deposit. Iran. Ore Geology Reviews, 150, 105133.
Manthiram, A. (2020). A reflection on lithium-ion battery cathode chemistry. Nature Communications, 11(1), 1550.
Maréchal, A. (1984). Recovery Estimation: A Review of Models and Methods. Springer EBooks, 385–420. https://doi.org/10.1007/978-94-009-3699-7_23
Mery, N., Emery, X., Cáceres, A., Ribeiro, D., & Cunha, E. (2017). Geostatistical modeling of the geological uncertainty in an iron ore deposit. Ore Geology Reviews, 88, 336–351.
Ortiz, J. M., & Emery, X. (2006). Geostatistical estimation of mineral resources with soft geo- logical boundaries: a comparative study. Journal of the Southern African Institute of Mining and Metallurgy, 106(8), 577–584.
Paithankar, A., & Chatterjee, S. (2018). Grade and tonnage uncertainty analysis of an African copper deposit using multiple-point geostatistics and sequential gaussian simulation. Natural Resources Research, 27, 419–436.
Roldão, D., Ribeiro, D., Cunha, E., Noronha, R., Madsen, A., & Masetti, L. (2012). Combined use of lithological and grade simulations for risk analysis in iron ore, Brazil. Geostatistics Oslo, 2012, 423–434.
Romary, T., Ors, F., Rivoirard, J., & Deraisme, J. (2015). Unsupervised classification of multivariate geostatistical data: Two algorithms. Computers & geosciences, 85, 96–103.
Romary, T., Rivoirard, J., Deraisme, J., Quinones, C., & Freulon, X. (2012). Domaining by clustering multivariate geostatistical data. Geostatistics Oslo 2012 (pp. 455–466). Springer.
Rossi, M. E., & Deutsch, C., V. (2014). Mineral Resource Estimation. Springer.
Scrucca, L., Fop, M., Murphy, T. B., & Raftery, A. E. (2016). mclust 5: clustering, classification and density estimation using Gaussian finite mixture models. The R journal, 8(1), 289.
Visbal-Cadavid, D., Mendoza, A. M., & De La Hoz-Dominguez, E. J. (2020). Use of Factorial Analysis of Mixed Data (FAMD) and Hierarchical Cluster Analysis on Principal Component (HCPC) for Multivariate Analysis of Academic Performance of Industrial Engineering Programs. Xi’nan Jiaotong Daxue Xuebao, 55(5). https://doi.org/10.35741/issn.0258-2724.55.5.34
Wackernagel, H. (2013). Multivariate Geostatistics: An Introduction with Applications. Springer.
Wilde, B.J., & Deutsch, C.V. (2012). Kriging and simulation in presence of stationary domains: developments in boundary modeling. Geostatistics Oslo 2012. Berlin, Germany, 289–300.
Yu, X., & Manthiram, A. (2021). Sustainable battery materials for next-generation electrical energy storage. Advanced Energy and Sustainability Research, 2(5), 2000102.
Acknowledgments
The first and second authors are grateful to Nazarbayev University for funding this work via the Collaborative Research Program 2023-2025 under contract No. OPCRP2023013. The third author acknowledges the funding provided by the National Agency for Research and Development of Chile through grant ANID Fondecyt 11220464.
Author information
Authors and Affiliations
Corresponding author
Ethics declarations
Conflict of Interest
The authors declare no conflicts of interest.
Appendix
Appendix
See Figure 18.

Madogram of indicators of geo-domains, Cu, and Co, Li, Mo, Ni (in estimation geo-domains 1 and 2) with the following long azimuths: 0 (blue dashed line), 45 (red dashed line), 90 (green dashed line), 135 (black dashed line), and vertical (cyan dashed line)
Rights and permissions
Open Access This article is licensed under a Creative Commons Attribution 4.0 International License, which permits use, sharing, adaptation, distribution and reproduction in any medium or format, as long as you give appropriate credit to the original author(s) and the source, provide a link to the Creative Commons licence, and indicate if changes were made. The images or other third party material in this article are included in the article's Creative Commons licence, unless indicated otherwise in a credit line to the material. If material is not included in the article's Creative Commons licence and your intended use is not permitted by statutory regulation or exceeds the permitted use, you will need to obtain permission directly from the copyright holder. To view a copy of this licence, visit http://creativecommons.org/licenses/by/4.0/.
About this article

Cite this article
Nasretdinova, M., Madani, N. & Maleki, M. A Stepwise Cosimulation Framework for Modeling Critical Elements in Copper Porphyry Deposits. Nat Resour Res (2024). https://doi.org/10.1007/s11053-024-10337-1
Received:
Accepted:
Published:
DOI: https://doi.org/10.1007/s11053-024-10337-1